
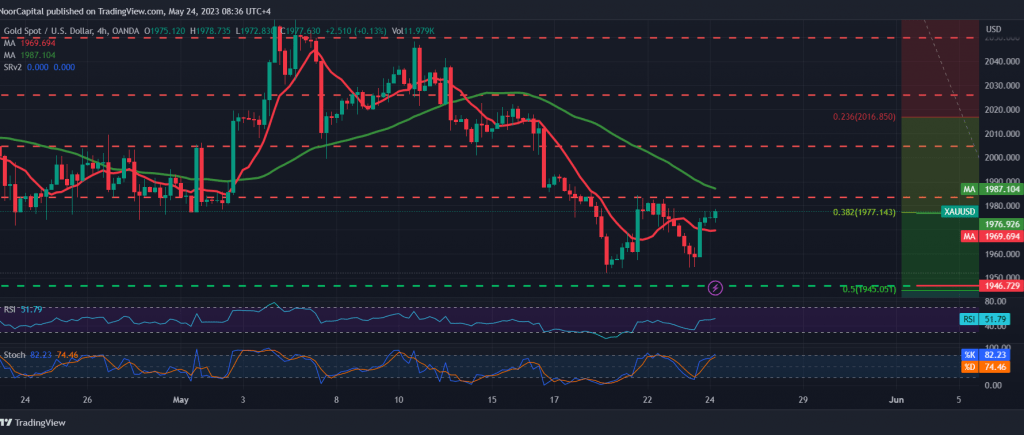
Gold prices continued the corrective decline mentioned during the last technical report, touching the first target located at 1960, recording its lowest level at $1954 per ounce.
Technically, gold prices are trying to bounce back due to touching the 1954 support level, which forced it to achieve a scenario of retesting the 1977 resistance. Simple moving averages.
The bearish scenario is still valid and active, and we await more downside moves to visit the second target of the current downside wave at 1945, located at 50.0% Fibonacci correction.
Closing the 4-hour candlestick above the main resistance level 1977 Fibonacci correction 38.20% may nullify the activation of the scenario suggested above, and gold will recover temporarily, trying to build a rising wave, with targets starting at 1986.
Note: Today we are awaiting highly sensitive economic data issued by the US economy, “the results of the Federal Reserve Committee meeting,” the speech of the US Treasury Secretary, and we are awaiting “inflation” data from the United Kingdom and the talk of the “Governor of the Bank of England,” in addition to the report issued by the International Energy Agency regarding Oil stocks, and we may witness high volatility in prices at the time of the news release.
Note: Trading on CFDs involves risks. Therefore, all scenarios may be possible. This article is not a recommendation to buy or sell but rather an explanatory reading of the price movement on the chart.
| S1: |