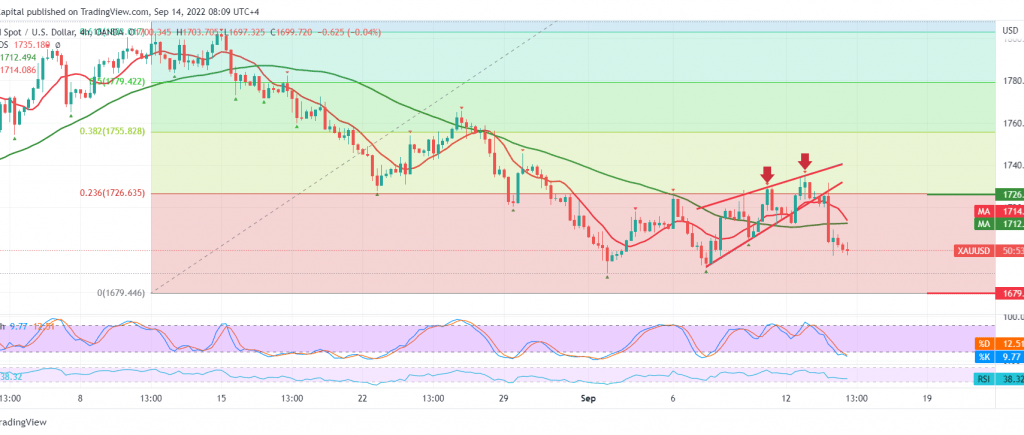
A noticeable decline in gold prices within the negative outlook as we expected, in which we relied on the stability of trading below 1726, and most importantly 1733 touching the required target 1710, explaining that breaking the target level increases the chances of touching 1695, recording its lowest level of 1697.
On the technical side today, and by looking at the 4-hour chart, we find that the intraday trading of gold is stable below the 1710 support barrier and in general, below 1726, the pivotal resistance represented by the 23.60% Fibonacci correction as shown on the chart, in addition to the clear negative signs on the RSI at short intervals.
Therefore, this encourages us to maintain our negative outlook, continuing toward the rest of the targets of the last analysis, 1687 and 1680 awaited price stations, considering that the decline below 1680 extends the losses to be waiting for an ounce of gold around 1675.
We remind you that rising above 1726 and most importantly 1733 may stop the proposed scenario, and we will witness a shift in the direction targeting 1743 and 1754 respectively.
Note: We are waiting for US inflation data “Producer Price Index,” which has a significant impact, and we may witness high price fluctuations.
Note: Trading on CFDs involves risks. Therefore, all scenarios may be possible. This article is not a recommendation to buy or sell but rather an explanatory reading of the price movement on the chart.
| S1: |
 Noor Trends News, Technical Analysis, Educational Tools and Recommendations

