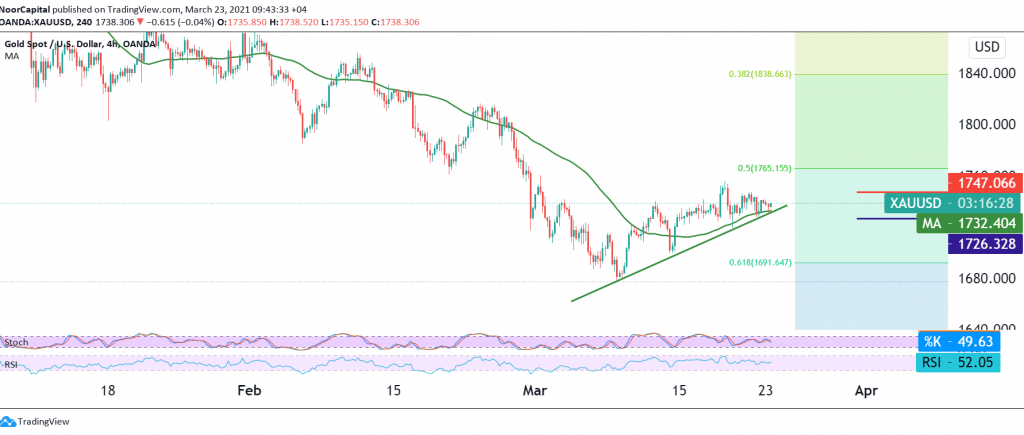
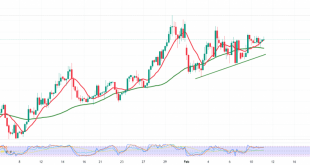
Gold prices succeeded in touching the first target required to be achieved during the previous analysis, located at a price of 1747, recording its highest level of 1747.
Technically speaking, and with a closer look at the chart, we find intraday trading is stable below 1747, accompanied by the loss of the RSI indicator, the bullish momentum over short periods of time.
On the other hand, we find the 50-day moving average holding the price from below, favoring the occurrence of an upward slope. We stand on the fence until a clearer direction, to be in front of one of the following scenarios:
Activating short positions needs to see price stability below the resistance level 1747. We also need to witness a clear breakout of the level of 1726, which increases the negative pressure to set the next targets at 1716 and extend towards 1706.
Activating long positions requires the breach of 1747, and this is a catalyst that enhances the bullish chances to retest 1756, and the gains may extend later to retest the pivotal resistance 1765, 50.0% retracement.
| S1: 1726.00 | R1: 1746.00 |
| S2: 1716.00 | R2: 1756.00 |
| S3: 1705.00 | R3: 1766.00 |
 Noor Trends News, Technical Analysis, Educational Tools and Recommendations

