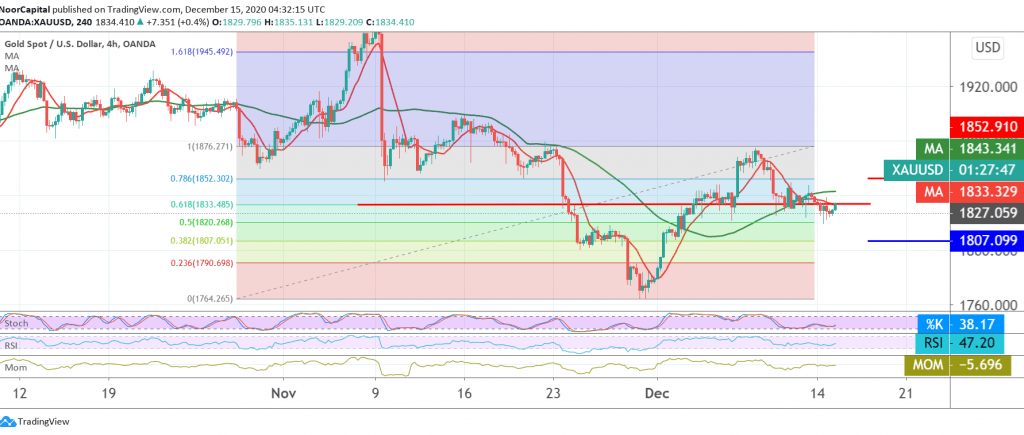
Gold prices succeeded in achieving the negative outlook, as we expected, in which we relied on trading below the 1833 level, heading to visit the first target to be achieved, 1818, recording its lowest level at 1818.60.
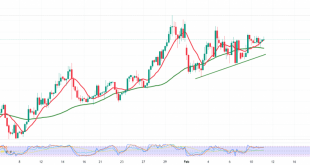
On the technical side, the current movements of gold are witnessing attempts to consolidate above the level of 1833 represented by the 61.80% Fibonacci as shown on the chart, we find the 50-day moving average is still pressing the price from the top, and this contradicts the positive signs that started to appear on the RSI for short time frames.
Although we tend to be negative, we are on the fence momentarily to maintain the profitability rates that have been achieved and until the more accurate and clear picture to face one of the following scenarios:
To maintain the daily bearish trend, we need to witness stability of the price below 1833, targeting 1822/1820, a 50.0% correction, a first target, bearing in mind that confirming the break of 1820 confirms the strength of the bearish bearish trend, to the next official stop 1807.
Activating long positions requires an advance over 1842 and more importantly 1851, which postpones the chances of a reversal but does not eliminate them. We may witness a slight bullish tendency targeting a re-test of 1863 before resuming the decline again.
In general, we are continuing to suggest the overall bearish trend as long as trading remains stable below 1870’s high.
Note: the risk level may be high today.
| S1: 1822.00 | R1: 1842.00 |
| S2: 1807.00 | R2: 1851.00 |
| S3: 1800.00 | R3: 1863.00 |
 Noor Trends News, Technical Analysis, Educational Tools and Recommendations

