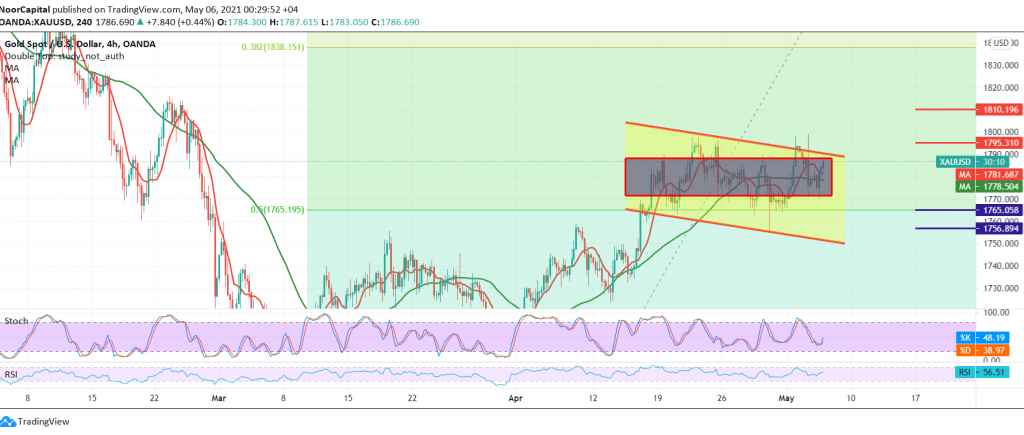
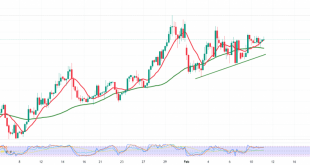
The sideways trading is still dominating gold’s movements within a sideways range confined from the bottom above the support level 1770 and from below below the resistance level of 1784.
On the technical side, we witnessed a successful retest of the support level of 1770, which forced the price to retrace the upside, stabilizing around its highest level in 1787. With a closer look at the 4-hour chart, we find a conflict between the positive motive of the 50-day moving average that came back to hold the price from below, And between the continuation of negative signs that continue to dominate Stochastic.
Therefore, with the continued decline in trading between the aforementioned levels, in addition to the conflicting technical signals, we stand on the fence and waiting one of the following scenarios:
Activating long positions requires a clear and strong break of the resistance level 1792/1795, which facilitates the task required to visit 1800 and 1810, respectively.
Activating short positions requires a clear break of the 1775 level, which puts the price under negative pressure targeting 1765 a 50.0% correction, and losses may extend later to visit 1756.
| S1: 1775.00 | R1: 1792.00 |
| S2: 1765.00 | R2: 1800.00 |
| S3: 1756.00 | R3: 1810.00 |
 Noor Trends News, Technical Analysis, Educational Tools and Recommendations

