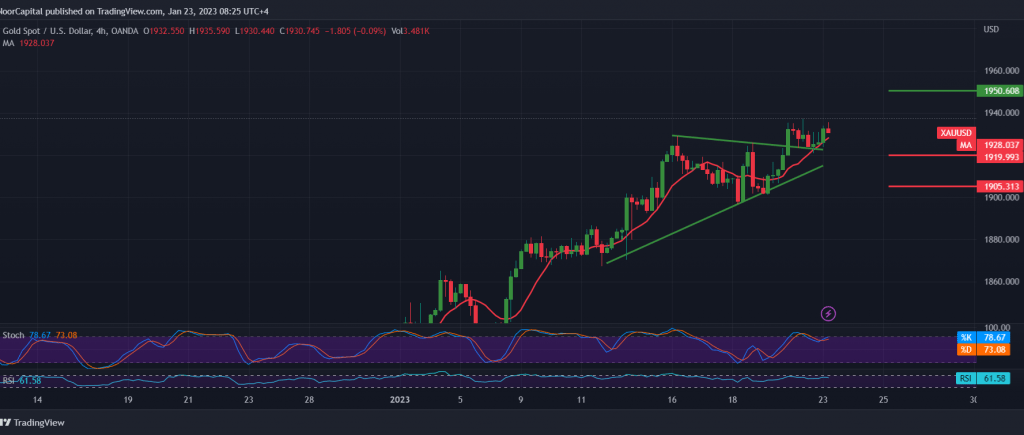
Gold prices continued achieving strong gains at the expense of the US dollar, as we expected within a gradual rise to visit the official target published during all technical reports last week at the price of 1950, recording its highest level at $1937 per ounce.
Technically, and with a closer look at the 4-hour chart, we find that the simple moving averages continue to support the daily bullish price curve, in addition to the intraday stability of the price above the support level of 1920, and in general, stability above the psychological barrier of 1900.
The bullish bias is more likely, maintaining the positive outlook, targeting 1938 first and then 1945, and the gains may extend to the official target of the current wave of rise at 1950.
Trading stability below 1920 postpones the chances of rising but does not cancel them, and we may witness a re-test of 1912 and 1905 before resuming the rise again.
Note: Overbought signs are clear on the stochastic, and we may witness price fluctuations until we get the official trend.
Note: Trading on CFDs involves risks. Therefore, all scenarios may be possible. This article is not a recommendation to buy or sell but rather an explanatory reading of the price movement on the chart.
| S1: |
 Noor Trends News, Technical Analysis, Educational Tools and Recommendations

