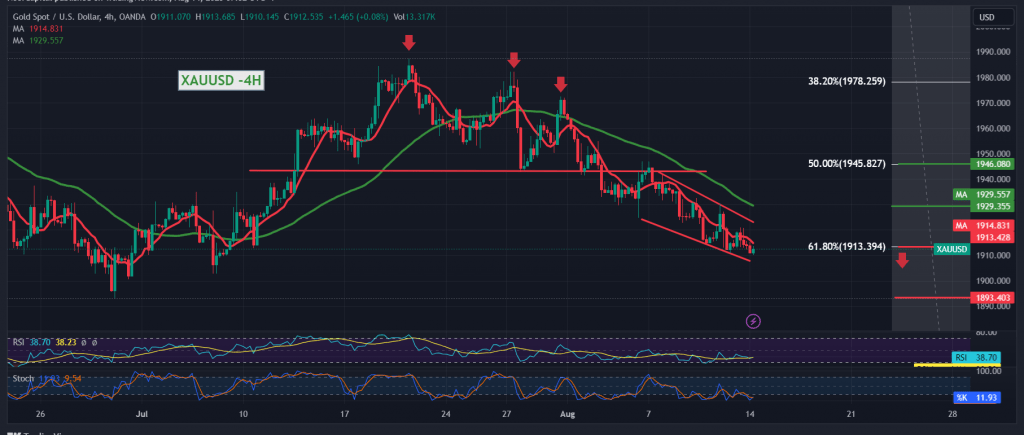
As we expected, gold prices continue to decline, touching the official target station during last week’s trading at 1913, recording its lowest level at $1912 per ounce.
On the technical side today, by looking at the 4-hour chart, with the continuation of the negative intersection of the simple moving averages, which constitute a strong impediment to gold prices, and continue to exert negative pressure on the price from above, in addition to the negative RSI signals and its stability below the midline 50.
From here, with steady daily trading below 1929, the bearish scenario remains the most likely during the current session’s trading, knowing that the price’s consolidation below 1913 correction of 61.80% facilitates the task required to visit 1906 and 1898, initial stations that extend later to visit 1886, a main target.
Suppose prices fail to achieve a real breach of 1913 level and return to consolidation above 1929. In that case, there may be a possibility for a bullish trend, aimed at retesting the pivotal resistance of 1945 50.0% correction, before falling again.
The price’s consolidation once again above 1.1000 postpones the chances of a decline but does not cancel it, and we may witness a retest of 1.1030 and 1.1060 initially.
Note: Trading on CFDs involves risks. Therefore, all scenarios may be possible. This article is not a recommendation to buy or sell but rather an explanatory reading of the price movement on the chart.
| S1: |
 Noor Trends News, Technical Analysis, Educational Tools and Recommendations

