
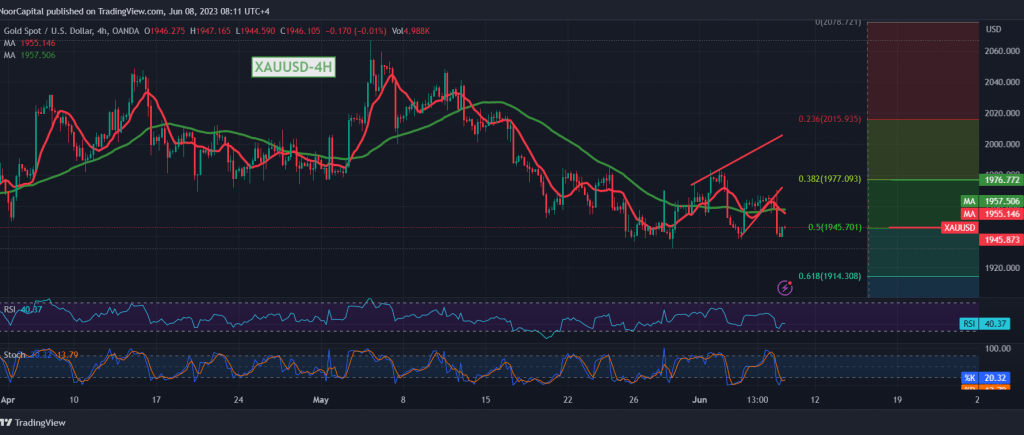
Throughout several consecutive sessions, we waited for the pending orders to be activated due to the sideways movements that dominated gold prices from below 1945 and from above below 1977, explaining that the decline below 1945 is a beginning signal for the resumption of the correctional decline, recording its lowest level at $1939 per ounce.
From the point of view of technical analysis, we find that gold achieved an initial break of the main support level of 1945, Fibonacci correction 50.0%, and started today’s session by pressing on the mentioned level.
We tend to be negative by confirming the breach of 1945, and that leads Gold to resume the corrective decline to visit 1933 and 1920, knowing that the official target is around 1913.
We remind you that gold’s failure to break 1945 correction of 50.0% could lead the price to recover with the target of 1965, and in general we continue to suggest the overall bearish trend as long as trading is stable below 1977 correction of 38.20%.
Note: Trading on CFDs involves risks. Therefore, all scenarios may be possible. This article is not a recommendation to buy or sell but rather an explanatory reading of the price movement on the chart.
| S1: |