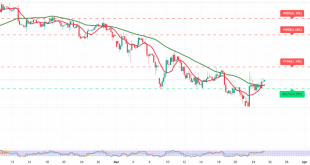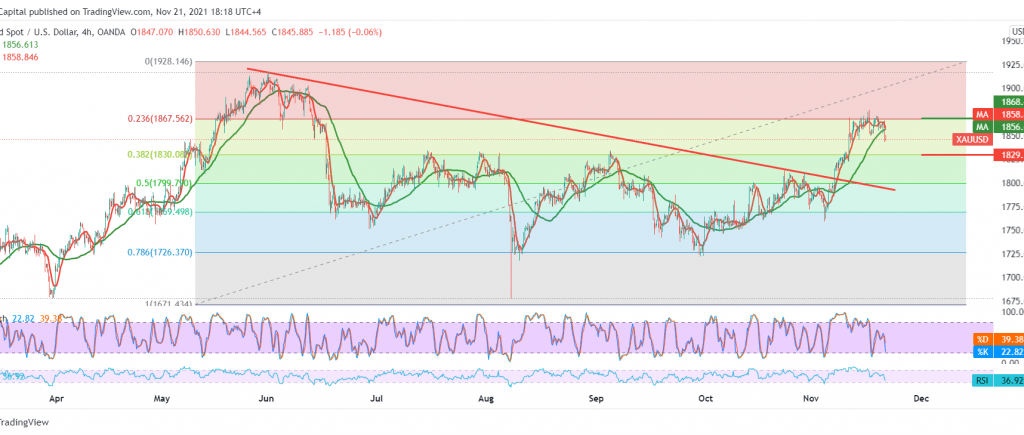
We adhered to intraday neutrality during the previous analysis due to the conflicting technical signals, explaining that activating the short positions depends on breaking the 1854 level to target 1835. Gold prices posted the lowest level at the end of last week at 1843.
Technically, there is a possibility of continuing the decline. The trading stability in general below the main resistance level 1868, 23.60% Fibonacci correction, which represents one of the most critical trend keys.
In addition to the momentum indicator that supports reaching lower price areas around 1837, knowing that breaking it opens the door to visit 1830, a correction of 38.20%.
Rising above 1859 will postpone the chances of a decline. Still, it does not cancel them, and we may witness a temporary bullish path that aims to retest the key supply areas in 1868 before resuming the decline again.
| S1: 1837.00 | R1: 1859.00 |
| S2: 1829.00 | R2: 1868.00 |
| S3: 1815.00 | R3: 1881.00 |