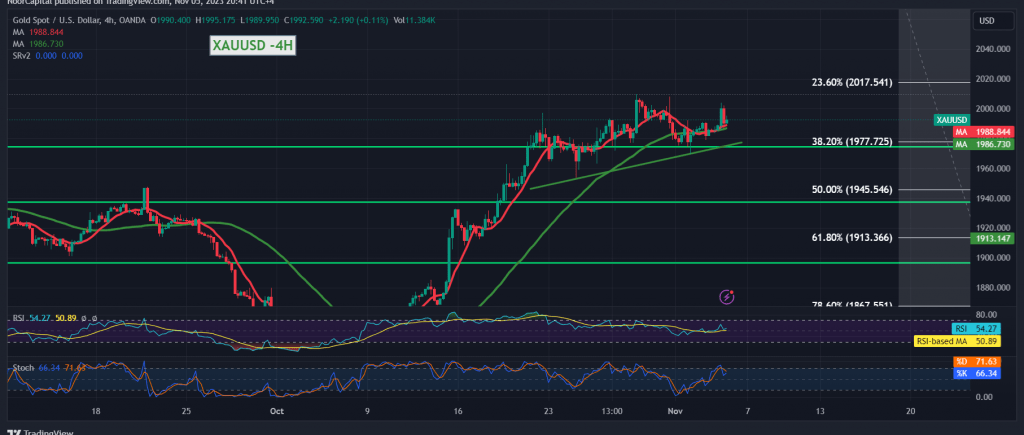
Gold prices exhibited a series of mixed trades during Friday’s trading session, oscillating in both upward and downward directions. As previously noted, the potential for an upward surge was evident if the price managed to consolidate above the crucial level of 1977, coupled with a confirmed breakthrough at 1994. This scenario would have propelled gold to reach its official target of $2004 per ounce.
From a technical standpoint, the resistance at 2004 exerted downward pressure on the price, compelling it to stabilize below the psychological barrier of $2000. Despite this, the simple moving average continues to support the potential for an increase. Additionally, the price’s consolidation above the key support level at 1977 contradicts the apparent negative signals observed in the market’s Stochastic indicator.
The future trajectory of gold prices hinges on how they behave in the coming sessions:
- Upward Trend: To sustain an upward trajectory, the price must remain stable above 1977, the 38.20% correction level. A decisive breach of the resistance at 2004 would significantly bolster the upward momentum, paving the way for further gains towards 2017. Subsequent extensions could lead to the price reaching $2030.
- Downward Trend: Conversely, a shift towards a downward trend would necessitate a break below 1977, with potential targets set at $1965 and $1958, respectively. Careful monitoring of price behavior will be crucial in determining the direction gold prices may take in the near term.
Note: Trading on CFDs involves risks. Therefore, all scenarios may be possible. This article is not a recommendation to buy or sell but rather an explanatory reading of the price movement on the chart.
| S1: |
 Noor Trends News, Technical Analysis, Educational Tools and Recommendations

