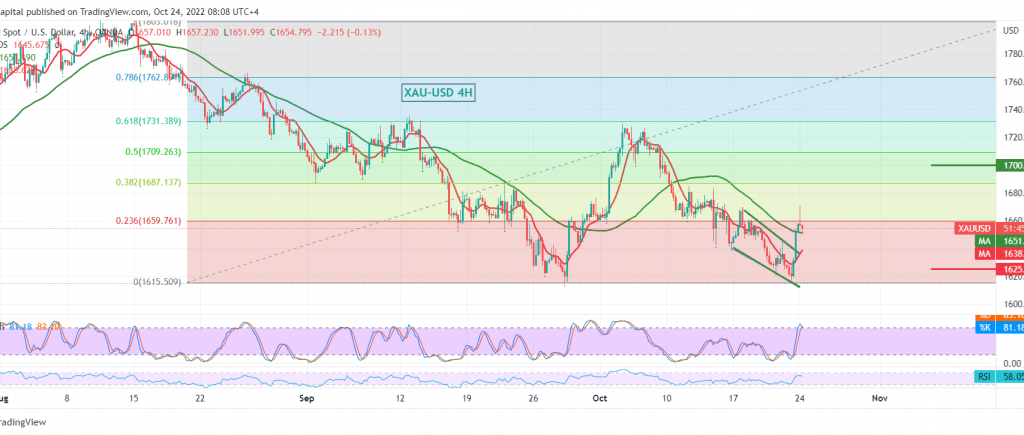
Mixed trading dominated the prices of the yellow metal during the last trading sessions of the last week, after it approached the official target of the last downside wave at 1632, recording its lowest level at 1617, to the bullish rebound, achieving strong gains, reaching the pivotal resistance level published during the last analysis located at 1670, which succeeded in limiting the bullish bias, and gold is now trading around $ 1653 per ounce
Technically, and by looking at the 4-hour chart, we find the 50-day simple moving average trying to support the daily bullish curve of prices, stimulated by the positive signals from the RSI on the 60-minute time frame, stable above the 50 mid-line.
Therefore, the possibility that we will witness a rise during the current session’s trading is still valid and effective, taking into account that the decline above 1677 increases and accelerates the strength of the daily bullish trend, to be waiting for the $1700 next official station, and then 1710 50.0% Fibonacci correction as long as the daily trading remains stable above the support floor. 1625.
The decline below 1624 will immediately stop the suggested bullish scenario and put gold under strong negative pressure, awaiting touching 1600, and the negative targets may extend towards 1594.
Note: The risk level is high.
Note: Trading on CFDs involves risks. Therefore, all scenarios may be possible. This article is not a recommendation to buy or sell but rather an explanatory reading of the price movement on the chart.
| S1: |
 Noor Trends News, Technical Analysis, Educational Tools and Recommendations

