
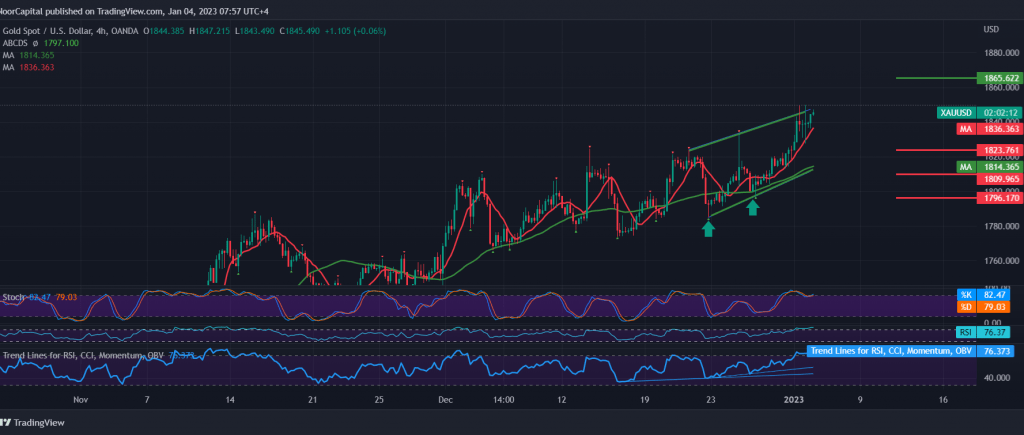
Gold prices managed to touch the required official target at 1850, recording its highest level at 1850, to decline significantly due to touching the pivotal resistance level of 1850 represented by the target, which forced the price to trade negatively to retest 1828 support.
Technically, and with a closer look at the 240-minute chart, we find that gold prices returned to a bullish rebound from above the support floor of 1828 and, in general, above 1810. In addition, we notice the stability of the price above the 50-day simple moving average, which continues to hold the price from below and is accompanied by momentum signals positivity.
Therefore, the bullish scenario may remain the most preferred, knowing that price consolidation above 1850 is a catalyst that enhances the chances of visiting 1855 and 1865, respectively, and the gains may extend later to visit 1870, as long as trading is generally stable above 1810.
The decline below 1810 can thwart the bullish daily trend, and gold starts a descending wave, with initial targets starting at 1797 and 1786.
Note: The minutes of the Fed’s latest policy meeting are set to come out in the afternoon, and we may witness high price volatility.
Note: Trading on CFDs involves risks. Therefore, all scenarios may be possible. This article is not a recommendation to buy or sell but rather an explanatory reading of the price movement on the chart.
| S1: |