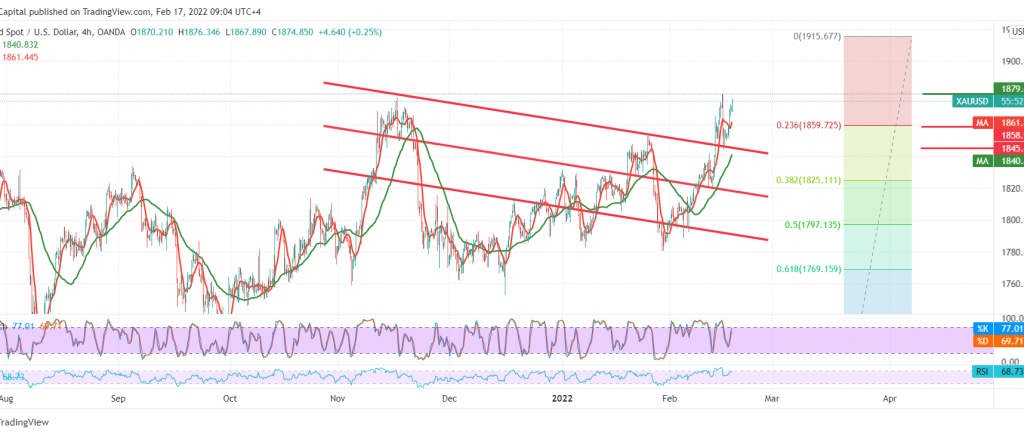
Positive moves dominated gold trades after testing the ascending channel’s support around 1844, which pushed it to rebound in the bullish direction to settle above 1859 resistance, and intraday stability above 1865.
Technically, by looking at the 240-minute chart, we notice that the price continued to obtain a positive stimulus from the 50-day moving average, which is still holding the price from below in support of the bullish price curve, in addition to the clear positive signs on the 14-day momentum indicator on short time frames.
Despite the technical factors that support the bullish bias, the limited trading between 1845 and 1879, the recently recorded high, makes us prefer to monitor the price behavior of gold to determine the next price destination.
Stability above 1878 might increase the probability of touching 1882, considering that its breach may increase the strength of the daily bullish trend to visit 1892, while the decline below the previously breached resistance-into-support 1859, 23.60% Fibonacci correction may put the price under negative pressure to re-test 1845.
Note: the level of risk is still high.
Note: Trading on CFDs involves risks. Therefore, all scenarios may be possible. This article is not a recommendation to buy or sell but rather an explanatory reading of the price movement on the chart.
| S1: |
 Noor Trends News, Technical Analysis, Educational Tools and Recommendations

