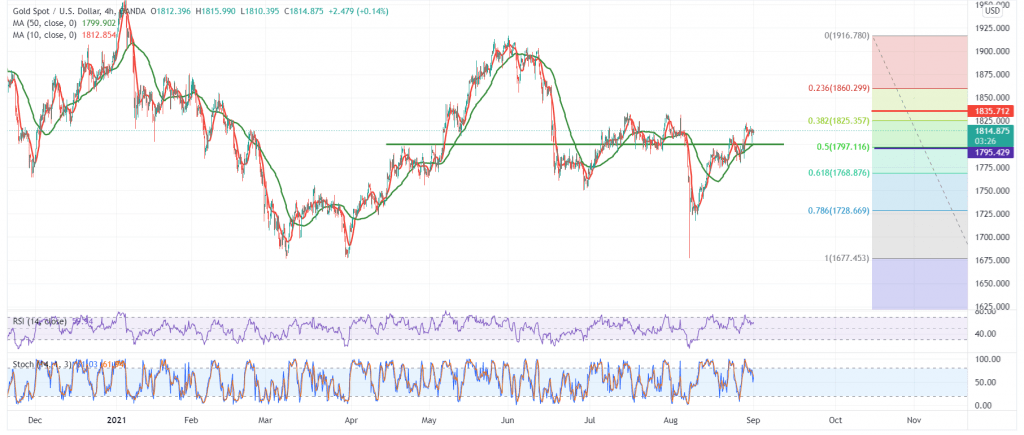
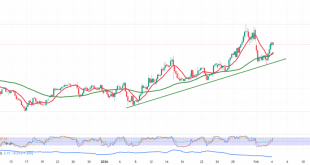
We stayed on the fence during the previous analysis due to the conflicting technical signals, clarifying that the pivotal support level 1799 represents the key to protecting the bullish trend.
Technically, the 50-day moving average is still a hurdle and holds the price from below, coinciding with the clear positive signs on the RSI.
From here, the intraday trading is stable above 1805/1804 and, in general, above the pivotal support 1799 represented by the 61.80% Fibonacci correction.
The bullish bias is likely today, provided that the breach of 1823 is confirmed to enhance the chances of rising towards 1829 and 1935, respectively. However, breaking 1799 will immediately stop any attempts to rise and turn the trend into a bearish direction, with targets starting at 1793 and 1786 initially.
| S1: 1804.00 | R1: 1.1835 |
| S2: 1.1700 | R2: 1.1885 |
| S3: 1.1665 | R3: 1.1940 |
 Noor Trends News, Technical Analysis, Educational Tools and Recommendations

