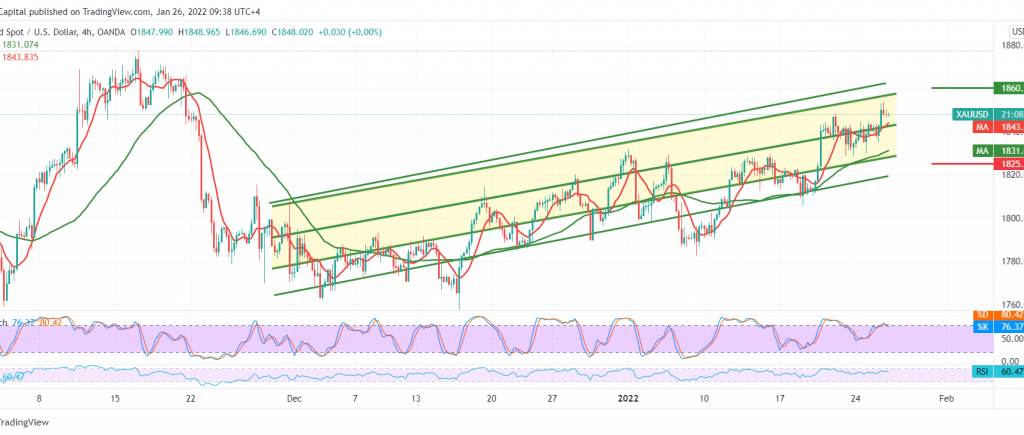
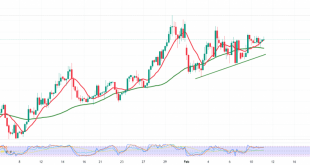
Gold managed to retest the support line of the ascending price channel shown on the chart located at 1825, maintaining the bullish bias and hovering around its highest level during the early trading of the current session 1844.
Technically, and carefully looking at the 4-hour chart, we notice the regularity of the movement within the bullish price channel, as we find the simple moving averages still supporting the bullish price curve, accompanied by the 14-day momentum indicator positive signs.
Thus, the bullish scenario might be the most preferred, but we need to witness the breach of 1847, which is a catalyst that contributes to consolidating the gains to visit 1853 and 1860 next official stations.
Stability of trading above 1825 is a basic and important condition to maintain the bullish trend, noting that confirming its break may force gold prices to enter a selling wave with the first target at 1817, while its official target at 1800.
Note: Fed statement is due today and may cause high volatility.
Note: CFD trading involves risks; all scenarios may occur.
| S1: 1836.00 | R1: 1855.00 |
| S2: 1825.00 | R2: 1863.00 |
| S3: 1817.00 | R3: 1874.00 |
 Noor Trends News, Technical Analysis, Educational Tools and Recommendations

