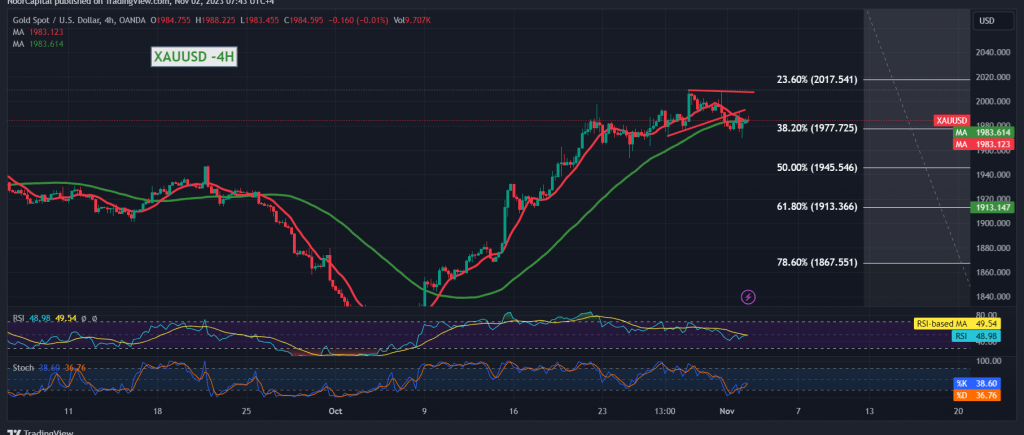
The formidable resistance level identified in the previous analysis at $1991 exerted significant downward pressure on gold prices, causing it to trade negatively and ultimately break the $1977 mark. Gold came within a few points of reaching the initial target of $1967, reaching its lowest point at $1969 per ounce.
On the 240-minute time frame chart, the price has remained below the sturdy resistance level at $1992. Additionally, the Stochastic indicator exhibits clear negative signals, indicating a potential continuation of the downward trend.
While the bias leans towards negativity, confirmation of a break below the strong support at $1977, represented by the 38.20% Fibonacci retracement, could pave the way for a visit to $1971 and $1967 as initial targets. Closing below $1967 would significantly intensify the downward momentum, potentially leading the price to the $1958 level without significant hindrance.
On the flip side, if the price manages to consolidate above $1977 and successfully breaches the $1994 level, this development could serve as a motivating factor for gold to resume its official upward trajectory. In such a scenario, the precious metal could target $2004 initially and extend its gains towards $2017, representing a 23.60% correction level.
Be aware that today, high-impact economic data originating from the British economy is anticipated, including the Bank of England governor’s speech, the interest rate decision, the monetary policy summary, the monetary policy report released by the Bank of England, and the Monetary Policy Committee’s vote on interest rates.
Note: Trading on CFDs involves risks. Therefore, all scenarios may be possible. This article is not a recommendation to buy or sell but rather an explanatory reading of the price movement on the chart.
| S1: |
 Noor Trends News, Technical Analysis, Educational Tools and Recommendations

