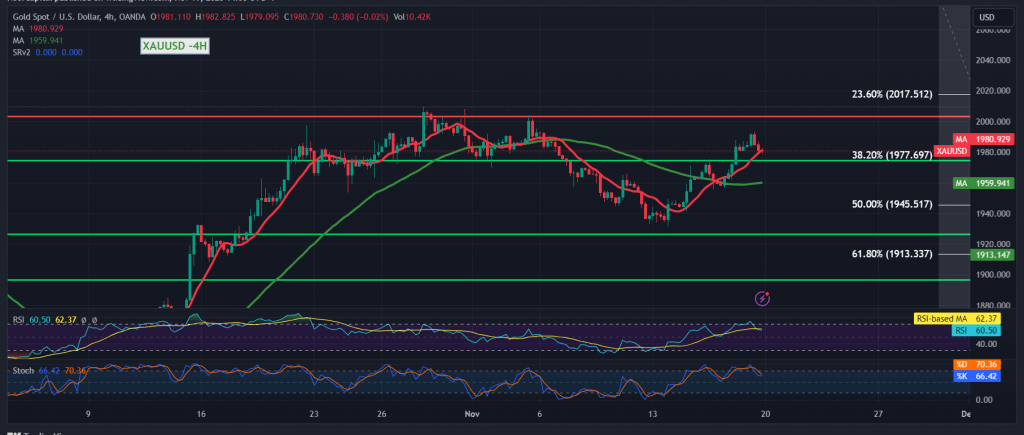
Gold exhibited an upward trend during the recent trading session, aligning with the anticipated upward trajectory and nearing the initial target set at the price of 1997. The precious metal recorded its highest point at $1993 per ounce.
Examining the technical aspects today, a closer look at the 4-hour timeframe chart reveals that the level of 1993 has established itself as a formidable resistance, prompting gold to conclude the week’s trading around 1980. Presently, the movements remain steady above a critical support level, 1977, representing the 38.20% Fibonacci retracement. The simple moving average continues to provide support from below.
In the event that the price successfully consolidates above 1977, there is potential for a resumption of the upward trajectory. The next targets include 1990 and subsequently 1998, serving as a pivotal station with further targets possibly extending towards 2004.
However, a failure to consolidate above the crucial support level of 1977 would subject the price to substantial negative pressure. Under such circumstances, a negative trading session is likely, with targets commencing at 1968 and extending towards 1959.
Caution is advised: The current geopolitical tensions elevate the risk level significantly, potentially leading to heightened price volatility. Investors should remain vigilant and exercise caution in response to market dynamics.
Note: Trading on CFDs involves risks. Therefore, all scenarios may be possible. This article is not a recommendation to buy or sell but rather an explanatory reading of the price movement on the chart.
| S1: |
 Noor Trends News, Technical Analysis, Educational Tools and Recommendations

