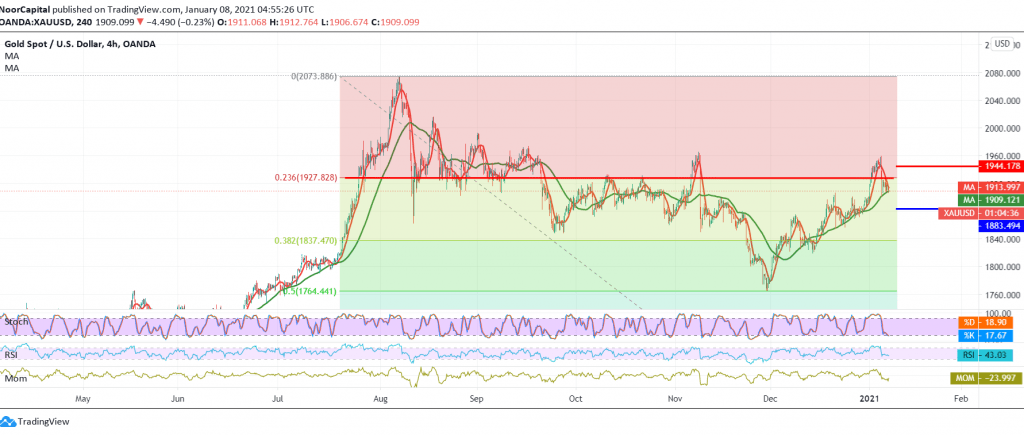
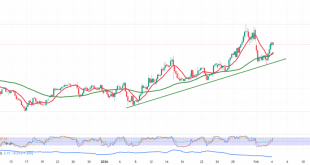
Negative trading is dominating the yellow metal’s movements after finding a strong resistance around 1927 which mentioned in the previous analysis, located at 23.60% Fibonacci retracement.
Technically speaking, we see the intraday movements settled around the lowest level during the morning at 1906, and by looking at the chart, we find the RSI is stable below the midline of 50 in support of the continuation of the decline. This coincides with the clear negative signs on the stochastic indicator.
Despite the technical factors supporting the continuation of the decline, we prefer to confirm that the level of support for the psychological barrier of 1900 has been broken. This facilitates the task required to visit 1892 the first target, and then 1880 official next stops.
The return of trading to stability above 1927 Fibonacci 23.60%, as shown on the chart, is able to negate the attempts to decline, and we may witness a bullish path with an initial target around 1934 and extends to 1942.
Note: US employment data are due today and may affect the price
| S1: 1900.00 | R1: 1921.00 |
| S2: 1892.00 | R2: 1934.00 |
| S3: 1879.00 | R3: 1942.00 |
 Noor Trends News, Technical Analysis, Educational Tools and Recommendations

