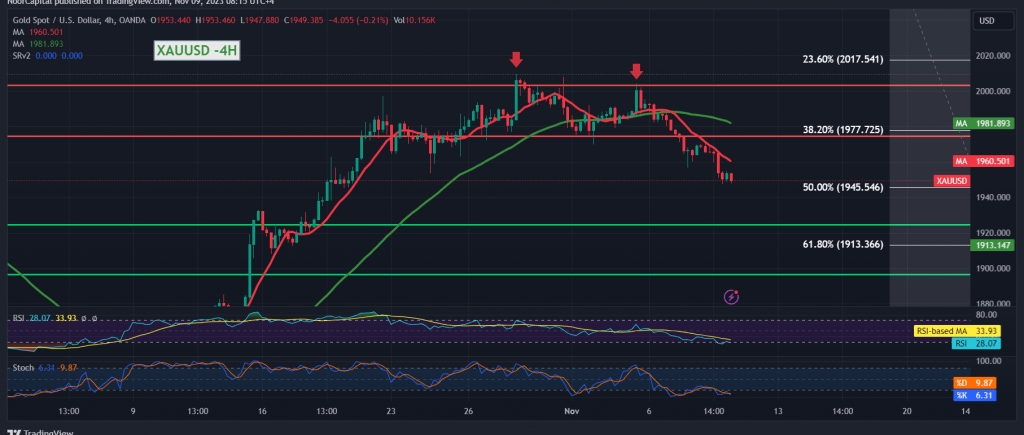
In the current market scenario, gold prices continue to follow the anticipated downward trajectory, nearing the initial target set in the previous report at $1945. During the early trading hours of the current session, gold touched a low of $1947 per ounce, underscoring the persistence of the bearish trend.
Analyzing the situation from a technical perspective, a detailed examination of the 4-hour time frame chart reveals the prevailing influence of the bearish technical formation. Additionally, daily trading remains below the critical resistance level of 1966, with ongoing pressure from the 50-day simple moving average.
In light of these factors, our bearish projections remain intact. The breach below $1945 represents the 50.0% Fibonacci retracement level, a crucial point deserving meticulous attention due to its significant impact on the short-term trend. A breakthrough here would pave the way for further declines, leading to potential targets at $1939 and $1934, which stand as crucial milestones.
It is essential to note that a potential reversal of this bearish scenario hinges on gold’s ability to maintain stability above the $1945 mark and subsequently regain a foothold above the 1966 resistance level. Such a development could thwart the downward momentum, with the possibility of gold prices retesting the 1977 correction level of 38.20%.
Investors are advised to exercise caution as high-impact press talks, including those featuring Federal Reserve Governor Jerome Powell and European Central Bank Governor Christina Lagarde, are on the horizon. These events may lead to heightened price fluctuations, underscoring the elevated risk level in the midst of ongoing geopolitical tensions.
Disclaimer: Trading decisions should be made with careful consideration of the risks involved, especially in the current geopolitical climate. Be prepared for potential high volatility in the market.
Note: Trading on CFDs involves risks. Therefore, all scenarios may be possible. This article is not a recommendation to buy or sell but rather an explanatory reading of the price movement on the chart.
| S1: |
 Noor Trends News, Technical Analysis, Educational Tools and Recommendations

