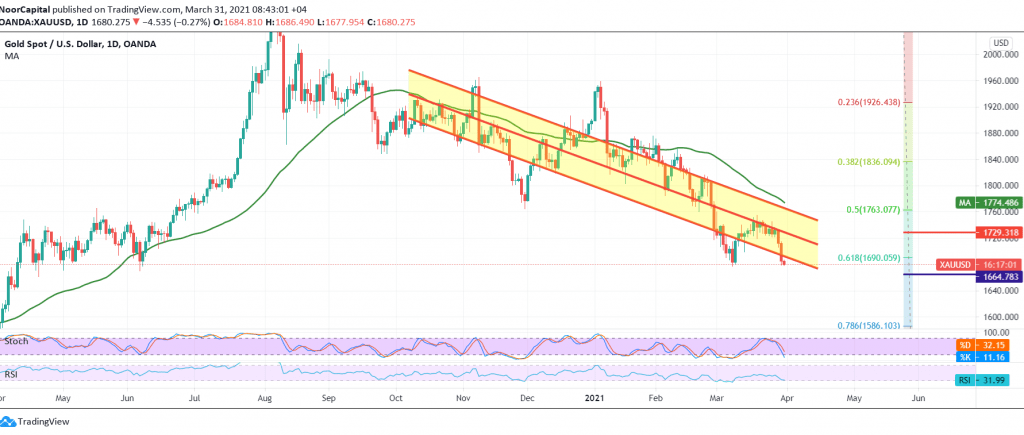
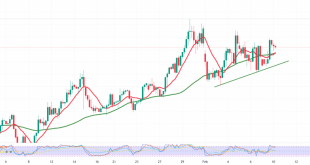
Gold prices retreated significantly within the bearish trend, as we expected, explaining that trading below 1691 extends gold’s losses, opening the way to visit 1685, recording its lowest price of 1678.
Technically, and by looking at the chart, the current prices of the yellow metal are witnessing stability below the previously broken pivot support, which is now converted to the resistance level of 1691, a correction of 61.80%, in addition to the continuation of the RSI indicator providing negative signals.
Consequently, the bearish scenario will remain valid and effective, targeting 1665 first targets, and then 1655 official stations following the current downturn wave.
From the top, the stability of trading above 1691 delays the chances of a decline, but does not eliminate them, and we may witness a re-test of 1702/1705 before resuming the decline again.
| S1: 1665.00 | R1: 1702.00 |
| S2: 1654.00 | R2: 1726.00 |
| S3: 1630.00 | R3: 1738.00 |
 Noor Trends News, Technical Analysis, Educational Tools and Recommendations

