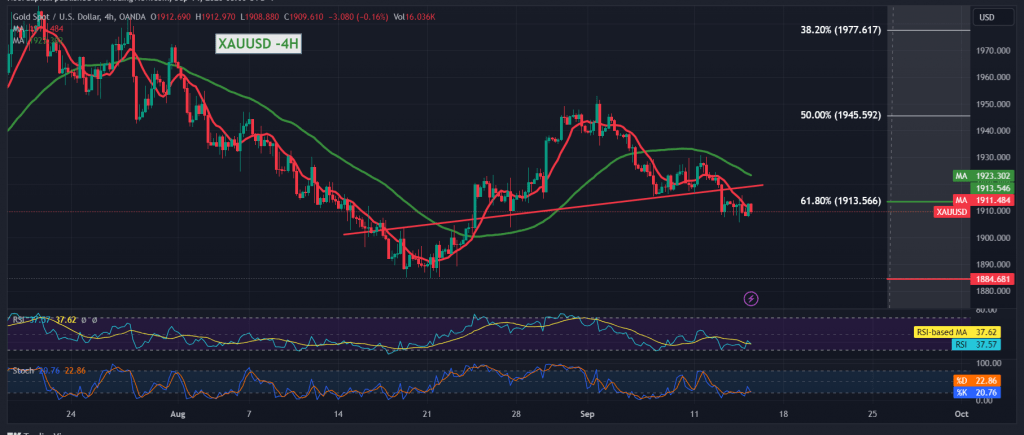
Negative trading dominated gold’s movements during the previous trading session within the bearish context, as we expected, approaching by a few points from the first target required to be achieved at the price of 1902, recording its lowest level of $1905 per ounce.
From the technical analysis angle today, we find that the intraday movements are stable below the 1913 support level represented by the 61.80% Fibonacci retracement, as shown on the 4-hour time frame chart, and we also find the simple moving averages continuing to pressure the price from above.
From here, with stable trading below 1920, and in general below the main resistance of 1929, the downward trend is the most preferred during the day, continuing towards the first target of the previous report, 1902, knowing that sneaking below the level above increases and accelerates the strength of the downward trend, so that we are waiting for 1896, the next official station that may extend later to 1885.
We remind you that price consolidation and stability above 1929 can thwart the downward trend immediately, and gold recovers directly to the visits of 1935 and 1945, the 50.0% correction, respectively.
Note: Today we are awaiting highly influential economic data issued by the European economy, “the monetary policy statement of the European Central Bank,” “interest rates on the euro and the press conference of the European Central Bank,” and regarding the American economy, we are awaiting the “producer prices” index and the “retail sales” index.
Note: Trading on CFDs involves risks. Therefore, all scenarios may be possible. This article is not a recommendation to buy or sell but rather an explanatory reading of the price movement on the chart.
| S1: |
 Noor Trends News, Technical Analysis, Educational Tools and Recommendations

