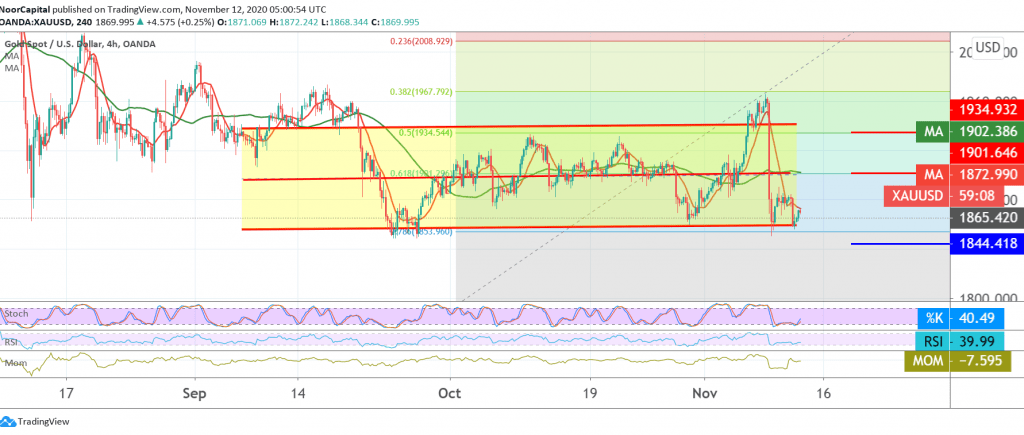
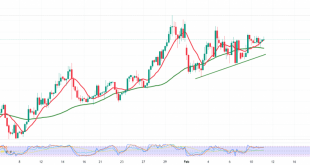
The bearish momentum continues to dominate gold’s movements within the expected bearish path, trying to break the bottom mentioned during the previous analysis, located at 1860, to record its lowest level at 1856.
technically, the current trading is still stable below the resistance level of 1880, and with a closer look at 240-minute chart, we find that the stochastic began to gradually lose the bullish momentum in addition to the negative pressure coming from the simple moving averages.
Therefore, we will maintain our negative outlook, noting that breaking 1860 facilitates the task required to visit the first official target of the current downside wave 1845/1842, and it is also necessary to pay close attention in the event that the mentioned level is broken, this may extend gold’s losses, opening the way towards 1828 later.
In general, we tend to suggest the bearish trend unless we witness any trading again above the previously broken support-into-resistance 1901, 61.80% Fibonacci retracement.
| S1: 1855.00 | R1: 1884.00 |
| S2: 1842.00 | R2: 1901.00 |
| S3: 1828.00 | R3: 1912.00 |
 Noor Trends News, Technical Analysis, Educational Tools and Recommendations

