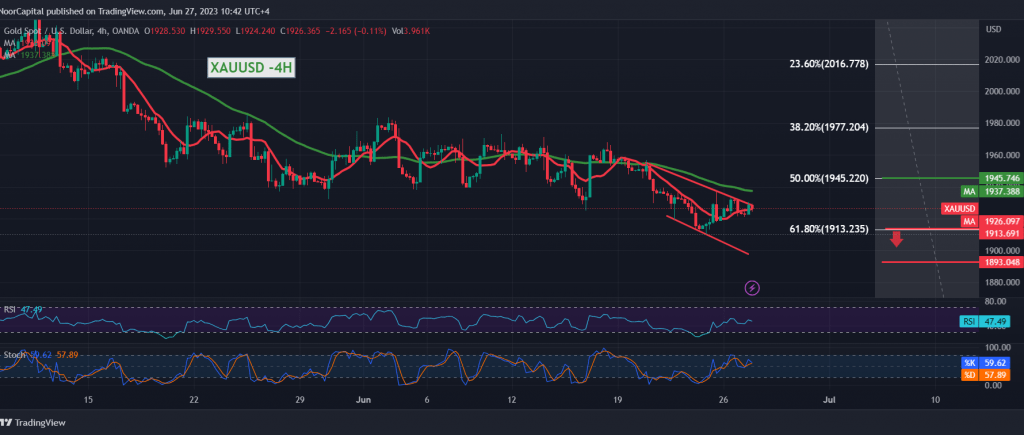
Gold prices continue the gradual decline to the downside within the bearish context, as we expected, to witness the current movement’s stability below the sub-resistance level of 1933.
On the technical side today, and with a closer look at the 240-minute chart, we find that the simple moving averages still support the daily bearish price curve, continuing to pressure the price from above, and it meets the 50-day average near 1938, adding more strength to it.
From here, with daily trading stability below the main resistance of the current trading levels, 1945, 50.0% correction, the bearish trend remains the most likely, targeting 1921 and 1913, 61.80% correction, an expected official station, knowing that breaking it leads gold prices to complete the current downward wave towards 1887.
Price consolidation above 1945 will immediately stop the suggested bearish scenario as gold prices recover temporarily to re-test 1963.
Note: Today we are awaiting high-impact economic data issued by the US economy, the “Consumer Confidence Index,” and we may witness high volatility at the time of the news release.
Note: Trading on CFDs involves risks. Therefore, all scenarios may be possible. This article is not a recommendation to buy or sell but rather an explanatory reading of the price movement on the chart.
| S1: |
 Noor Trends News, Technical Analysis, Educational Tools and Recommendations

