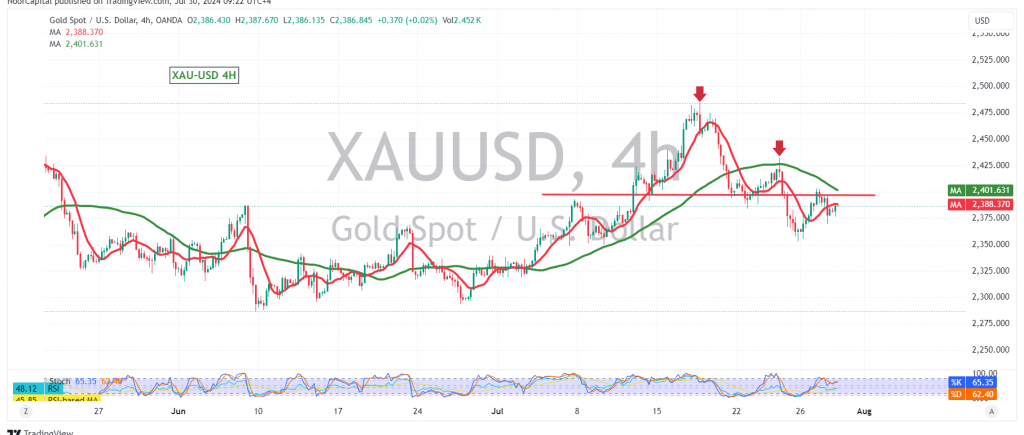
Gold prices continue to fluctuate within a narrow range, bounded by the support level at 2366 and the resistance level at 2394.
From a technical analysis standpoint, the simple moving averages are acting as resistance, while trading remains below the key resistance level of 2394. This bearish sentiment is further reinforced by the technical structure observed on the 4-hour chart. However, the Relative Strength Index (RSI) is starting to show positive signals, suggesting potential upward movement as long as the price remains above the support level of 2366.
Given the current price consolidation and mixed technical signals, it is prudent to monitor the price action closely for potential breakouts or breakdowns:
- A breakout above 2394 could signal a resumption of the uptrend, with initial targets at 2410 and 2420, and further potential gains extending to 2437.
- Conversely, a break below 2366 would likely indicate a continuation of the downward correction, with targets at 2352 and 2335.
Caution: The release of the “Consumer Confidence” report from the US could introduce significant price volatility. Exercise caution as risks may be elevated.
Disclaimer: Trading in CFDs involves risks, and all scenarios are possible. This analysis is not investment advice but rather an interpretation of the current technical landscape for gold.
| S1: |
 Noor Trends News, Technical Analysis, Educational Tools and Recommendations

