
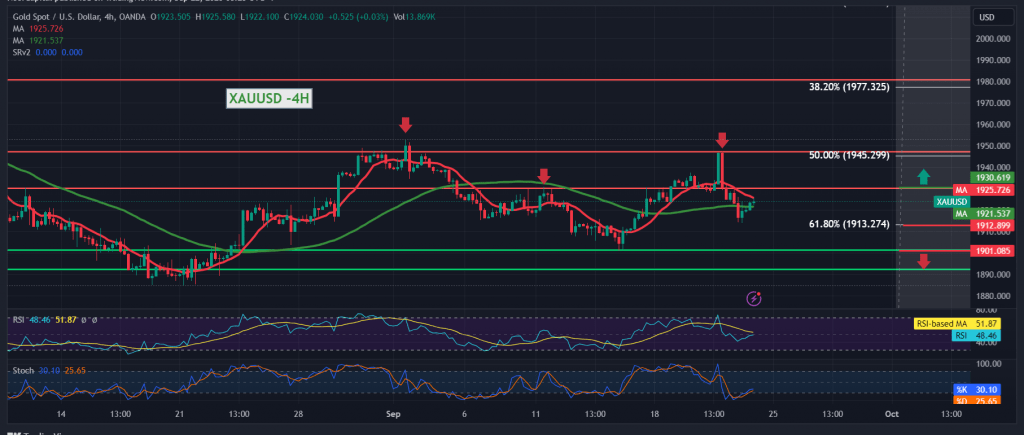
Gold prices found a strong resistance level, as we indicated during the previous technical report, at the price of 1930, which forced the price to trade negatively, explaining that sneaking below 1922 support level forces gold prices to retest the main support of the current trading levels, 1913, touching the target, recording $1,913 per ounce.
On the technical side today, we find gold prices hovering around the 50-day simple moving average and trying to stabilize above, accompanied by stability above the 1913 support level, which supports the possibility of a rise. On the other hand, we notice clear negative features on the Stochastic indicator and trading stability below the 1930 resistance level, which increases the possibilit of Resuming the downward trend that began yesterday.
With conflicting technical signals, we prefer to monitor price behavior to obtain a high-quality deal, so we are faced with one of the following scenarios:
Confirmation of breaking the main support floor 913 Fibonacci retracement 61.80% extends gold’s losses as we wait for 1904 and 1900, respectively, and the losses may extend to visit 1895.
Crossing upwards and the price consolidating above the pivotal resistance of 1930 is a motivating factor that facilitates the task required to visit 1940 and 1945.
Note: The risk level is high.
Note: Trading on CFDs involves risks. Therefore, all scenarios may be possible. This article is not a recommendation to buy or sell but rather an explanatory reading of the price movement on the chart.
| S1: |