
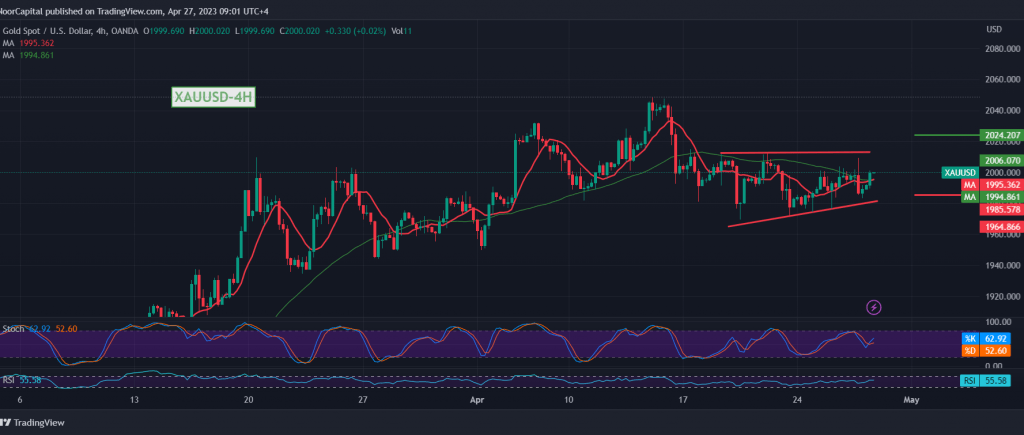
Gold prices reversed the bearish corrective trend, as we expected during the previous technical report, in which we relied on the negativity of technical indicators, in addition to the stability of trading below the 2006 resistance level at the time of the report’s release, recording its highest level at $2009 per ounce.
Technically, and with a closer look at the 4-hour chart, we find that the simple moving averages have returned to hold the price from below, and this comes in conjunction with the price obtaining positive signals from the stochastic indicator. Despite the technical factors that support the possibility of an increase, the prices It is still below 2006 resistance of the symmetrical triangle as shown on the chart.
We need to witness a clear breach of the mentioned resistance level to stimulate the price to visit 2011 and 2023, respectively, considering that the breach of 2023 increases and accelerates the strength of the bullish trend towards 2037.
It should be well noted that the price’s failure to breach 2006 makes the possibility of the corrective decline mentioned in the previous report valid and effective to target 1985 and 1971.
Note: the risk level may be high today.
Note: Today we are awaiting high-impact economic data issued by the US economy, “the estimated reading of the gross domestic product,” and we may witness fluctuations in prices at the time of the news.
Note: Trading on CFDs involves risks. Therefore, all scenarios may be possible. This article is not a recommendation to buy or sell but rather an explanatory reading of the price movement on the chart.
| S1: |