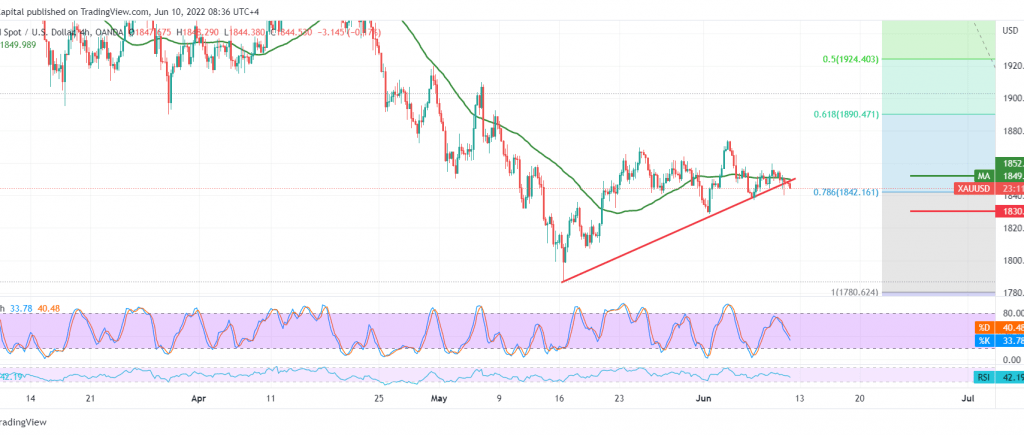
Sideways trading in a narrow range still dominated gold’s movements, confined from the bottom above the support level of 1838 and above below the resistance level of 1855.
Technically, and by looking at the 4-hour chart, we tend to the negativity, relying on the price stability below 1850, and the negative pressure of the 50-day simple moving average, reducing the bullish momentum.
Despite the technical factors that support the possibility of a decline during today’s session, we prefer to monitor the price behaviour around 1838, and breaking the mentioned level puts the price under strong negative pressure, its initial target is 1831 and then 1825 in a row, and losses may extend later to visit 1810.
Rising above 1850 and, most importantly, 1853 can thwart attempts to break and gold recovers with goals starting at 1861 and extending later towards 1868.
Note: Trading on CFDs involves risks. Therefore, all scenarios may be possible. This article is not a recommendation to buy or sell but rather an explanatory reading of the price movement on the chart.
| S1: |
 Noor Trends News, Technical Analysis, Educational Tools and Recommendations

