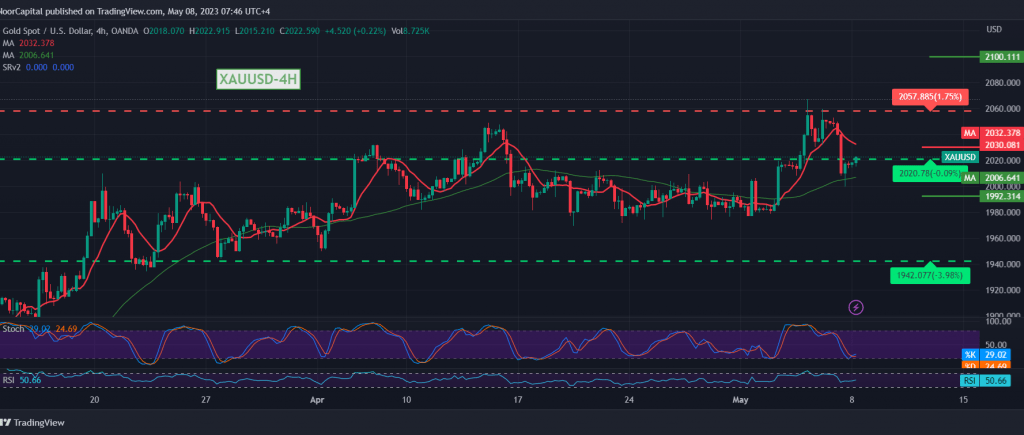
Gold prices gave up their recent gains last Friday to move away from the peak recently recorded at $2067, under pressure from the rise of the US dollar after the US jobs data, to record gold prices to their lowest level of $2016 per ounce.
Technically, and by looking at the 4-hour chart, the current movements witness stability below the 2030 resistance level around the 50-day simple moving average, in addition to the clear negative signs on the RSI.
We tend to be negative, but with caution, targeting 2016 as the first target, considering that breaching the target level initially leads gold prices to enter a bearish correction, with a target of 1990/1993.
Rising above the 2030 resistance level nullifies the activation of the proposed scenario, and gold prices may witness a recovery towards 2045.
Note: The level of risk is high, careful consideration is required, and all scenarios are likely to occur.
Note: Trading on CFDs involves risks. Therefore, all scenarios may be possible. This article is not a recommendation to buy or sell but rather an explanatory reading of the price movement on the chart.
| S1: |
 Noor Trends News, Technical Analysis, Educational Tools and Recommendations

