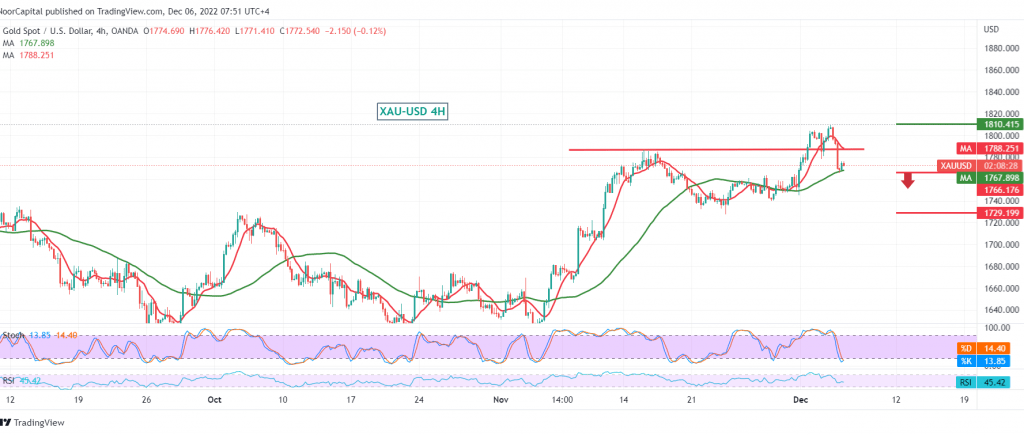
Negative trading dominated gold’s movements at the beginning of this week’s trading after it touched its highest level since last June, around $1810 per ounce. As a reminder, we indicated during the previous analysis that the decline below 1786 leads gold to retest 1768, recording its lowest level at 1765.
Technically, and by looking at the 4-hour chart, we notice that the 50-day simple moving average provides a positive motive accompanied by the stability of intraday trading above 1770, which supports the return of positivity; on the other hand, gold failed to maintain trading above the support level of the ascending channel 1786 In addition to declining momentum, technical factors favour negativity.
With conflicting technical signals, we prefer to monitor the price behavior to be in front of one of the following scenarios:
Breaking 1764 forces gold prices to enter a corrective downward wave, with targets starting at 1754 and extending towards 1737.
Consolidation once again above 1777, and most notably 1786, is a catalyst and signal for the return of the bullish trend, targeting 1800 and 1818, respectively, and targets may extend later towards 1828.
Note: Trading on CFDs involves risks. Therefore, all scenarios may be possible. This article is not a recommendation to buy or sell but rather an explanatory reading of the price movement on the chart.
| S1: |
 Noor Trends News, Technical Analysis, Educational Tools and Recommendations

