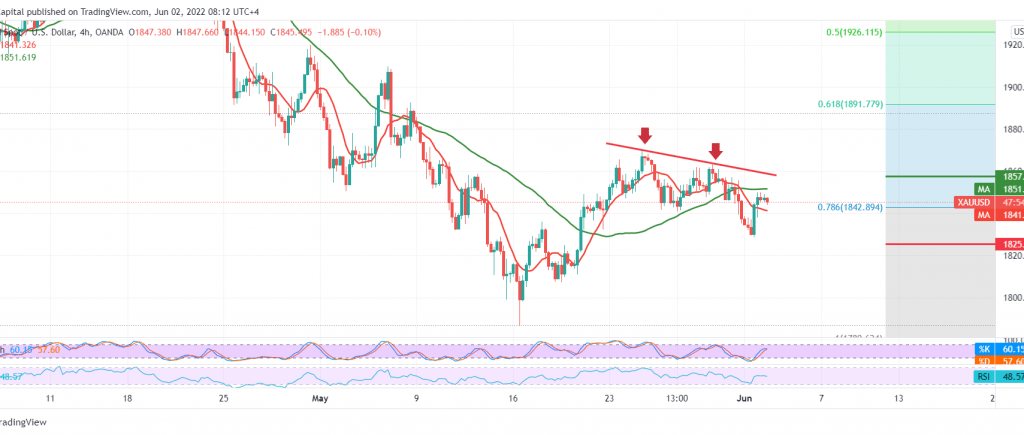
Sideways trading without a clear direction dominated gold prices during the previous trading session to retest the 1850 resistance, unable to consolidate above it.
Technically, and by looking at the 4-hour chart, we find gold stable below 1850, the previously broken support and now converted into a resistance level accompanied by negative pressure coming from the simple moving averages that started to pressure the price from above, in addition to the bearish technical structure shown on 240-minutes chart.
Therefore, chances of a decline may be available today, but on the condition that we witness a clear and strong break of the 1838/1840 support level, targeting 1832 and then the next 1825 price station, and breaking it increases and accelerates the strength of the bearish bias, opening the door to visit 1818 and it may extend towards 1810 as long as the price is stable below 1857.
Rising above 1857 can thwart the expected bearish scenario, and gold recovers to retest 1865.
Note: Trading on CFDs involves risks. Therefore, all scenarios may be possible. This article is not a recommendation to buy or sell but rather an explanatory reading of the price movement on the chart.
| S1: |
 Noor Trends News, Technical Analysis, Educational Tools and Recommendations

