
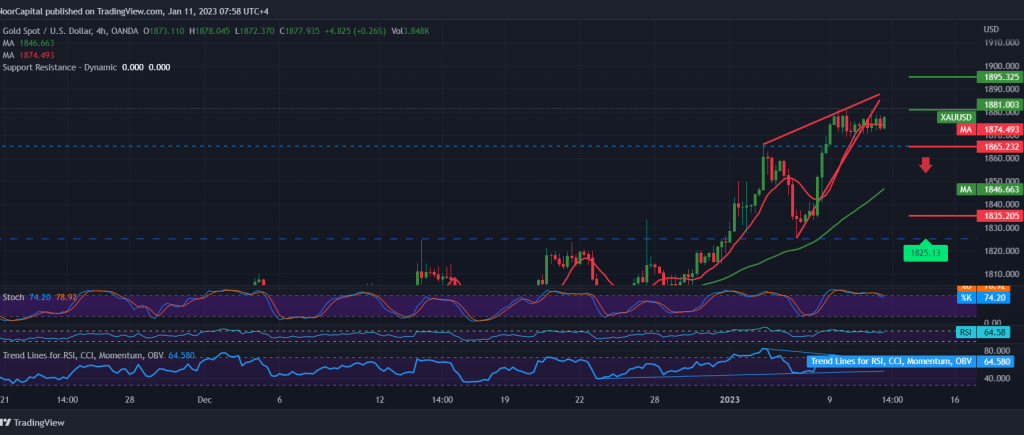
Sideways trading dominated gold’s movements yesterday, trying to attack the main resistance level of the current price range at 1880 but unable to breach it until now.
Technically, by looking at the chart with a 4-hour interval, we find the simple moving averages support the daily bullish price curve accompanied by the price stability above the strong support floor 1865; on the other hand, we notice signs of negativity began to appear on the stochastic indicator accompanied by trading stability below the pivotal resistance 1880.
With conflicting technical signals, we prefer to monitor the price behavior for the second session in a row to obtain a high-quality deal, to be in front of one of the following scenarios:
Resuming the bullish trend requires that we witness a clear and strong breach of 1880 resistance, increasing the strength of the bullish trend, opening the door to visit 1887 and 1895, next stations that may extend later towards 1910.
If gold fails to breach 1880 and returns to trading again below 1865, we may witness the beginning of a corrective decline, its initial target 1845, and later extending towards 1835.
Note: Trading on CFDs involves risks. Therefore, all scenarios may be possible. This article is not a recommendation to buy or sell but rather an explanatory reading of the price movement on the chart.
| S1: |