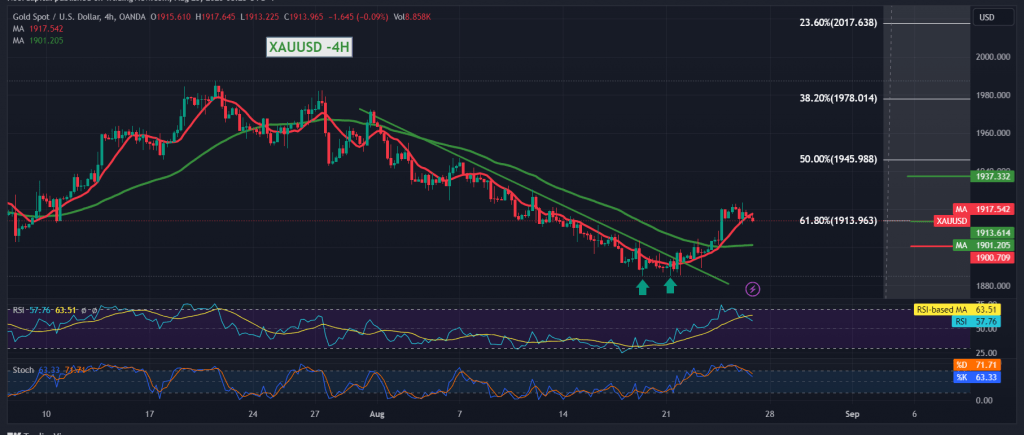
Limited positive attempts dominated gold’s movements during the previous trading session. Still, it collided with the minor resistance level at 1922, which forced it to trade negatively to the downside.
Technically, by looking at the 4-hour chart, the 50-day simple moving average still holds the price from below, supporting the possibility of an increase. Gold is currently hovering around the 1913 level of 61.80% Fibonacci correction, and the stochastic is trying to gain additional momentum.
From here, with the steadiness of intraday trading above the support floor of 1913, 61.80% correction, we may witness positive attempts targeting 1920/1923. We must pay close attention to this level due to its importance to the general trend in the short term, and its breach increases and accelerates the strength of the bullish tendency, to be waiting for touching 1927 and 1936 waiting stations.
Only from below, infiltration below 1913, with at least an hourly candle closing below it, puts the price under negative pressure again, to be waiting for the return of the official bearish trend, with targets starting at 1908 and 1903.00, and the losses extend towards 1885.
Note: Today we are awaiting economic data from “Jackson Hole Economic Forum”, “Speech by Lagarde, President of the European Central Bank” and “American Consumer Confidence from the University of Michigan”, and we may witness high volatility in prices.
Note: Trading on CFDs involves risks. Therefore, all scenarios may be possible. This article is not a recommendation to buy or sell but rather an explanatory reading of the price movement on the chart.
| S1: |
 Noor Trends News, Technical Analysis, Educational Tools and Recommendations

