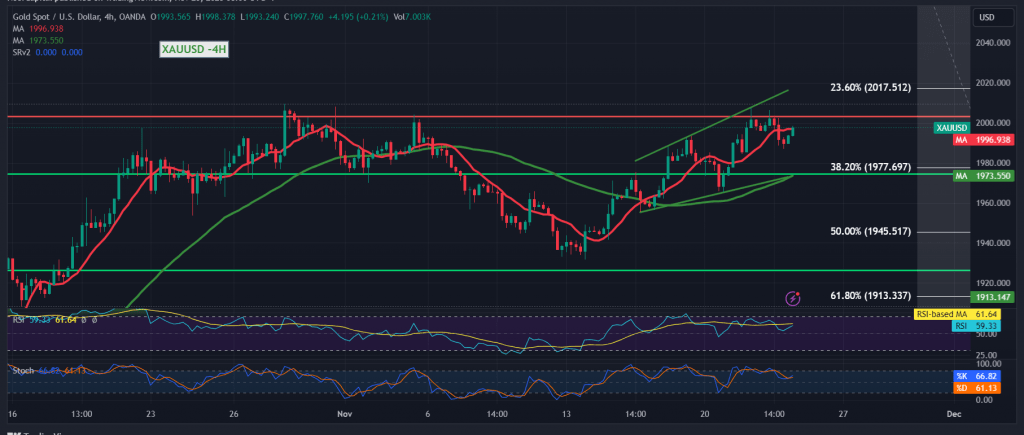
The technical landscape for gold remains unchanged, with the precious metal exhibiting consistent positive stability and maintaining a steadfast position above the key support level at 1977.
In today’s technical analysis, the price is observed to be resiliently positioned above the crucial support floor at 1977, representing the 38.20% Fibonacci retracement. The 50-day simple moving average, ascending from below and intersecting around 1977, reinforces its significance. Additionally, the Momentum 14 indicator exhibits ongoing attempts to gain momentum.
Sustained stability in trading above the pivotal support floor of 1977 bolsters our positive outlook, contingent on a breakthrough of 2007. This breakthrough acts as a catalyst, paving the way for substantial gains, commencing at 2014/2016 and extending towards 2023.
Conversely, failure to consolidate above the critical support at 1977 places gold under considerable negative pressure, with potential downside targets initiating from 1963.
A note of caution is warranted as we await impactful economic data from the Eurozone (preliminary readings of the services and manufacturing PMI indices from France and Germany) and the United Kingdom (preliminary reading of the services and manufacturing PMI index). Anticipated news releases may induce heightened price fluctuations.
The risk level remains elevated, emphasizing the importance of monitoring key levels, notably 1977 from below and 2009 from above.
Caution: The current geopolitical tensions introduce an additional layer of risk, potentially resulting in increased price volatility.
Note: Trading on CFDs involves risks. Therefore, all scenarios may be possible. This article is not a recommendation to buy or sell but rather an explanatory reading of the price movement on the chart.
| S1: |
 Noor Trends News, Technical Analysis, Educational Tools and Recommendations

