
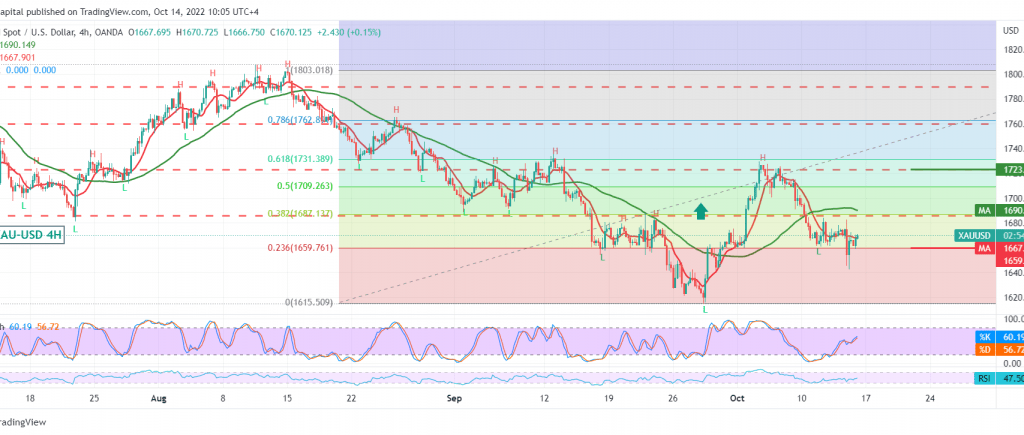
Divergent movements dominated the gold’s moves during the last session within a sideways path between 1660 and 1670.
Technically, by looking at the 4-hour chart, we find that Stochastic gradually loses bullish momentum and is motivated by the continuation of the negative pressure coming from the 50-day simple moving average.
Despite the technical factors that support the possibility of a drop, we prefer to confirm the break of 1660, and this facilitates the task required to visit 1646 first target, and then 1630 price stations are awaited unless we witness any trading and consolidation of the price above 1686.
The success of gold prices in consolidating above the strong resistance level 1686, the 38.20% Fibonacci correction can thwart the bearish bias and temporarily lead the price to recover, targeting 1704 and 1710 initial targets.
Note: “US Retail Sales” is due today and may witness price fluctuation.
Note: Trading on CFDs involves risks. Therefore, all scenarios may be possible. This article is not a recommendation to buy or sell but rather an explanatory reading of the price movement on the chart.
| S1: |