
Gold prices jumped at the beginning of this week’s trading, achieving significant gains, surpassing the official target mentioned last Friday at 1910, recording its highest level at $1929 per ounce.
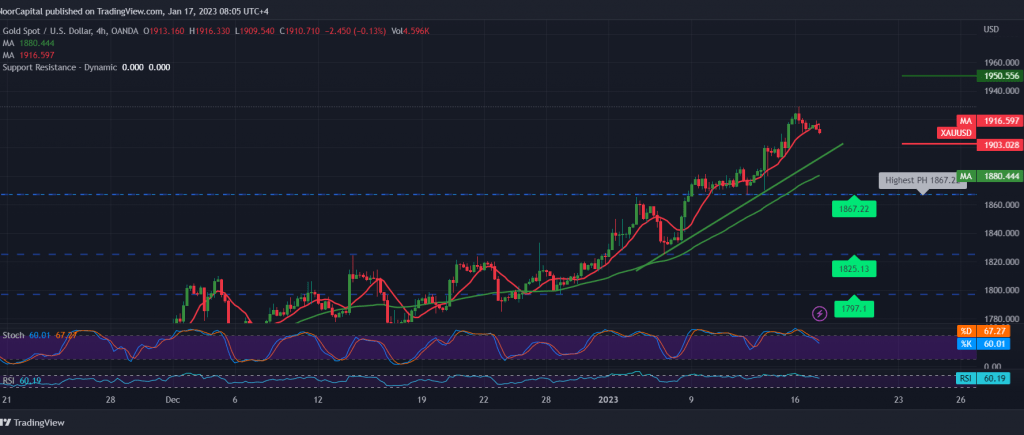
Technically, by looking, we find the 1930 resistance level that formed an obstacle in front of the price to force it to trade in negativity, and the current movements are witnessing stability around its lowest level during the session 1910; the stochastic provides negative signals on the 4-hour time frame and started to lose bullish momentum, on the other hand, the average is still The 50-day simple moving average supports the upside.
We may witness a bearish tendency in the coming hours, aiming to retest 1903. We must monitor the price behavior around this level due to its importance to the current trading levels, and breaking it may extend the retest to visit 1896/1897 initially.
Note: The bearish slope does not contradict the general bullish trend, whose official targets are around 1935 and 1950, once the breach of 1930 is confirmed.
Note: Risk levels may be high today.
Note: Trading on CFDs involves risks. Therefore, all scenarios may be possible. This article is not a recommendation to buy or sell but rather an explanatory reading of the price movement on the chart.
| S1: |