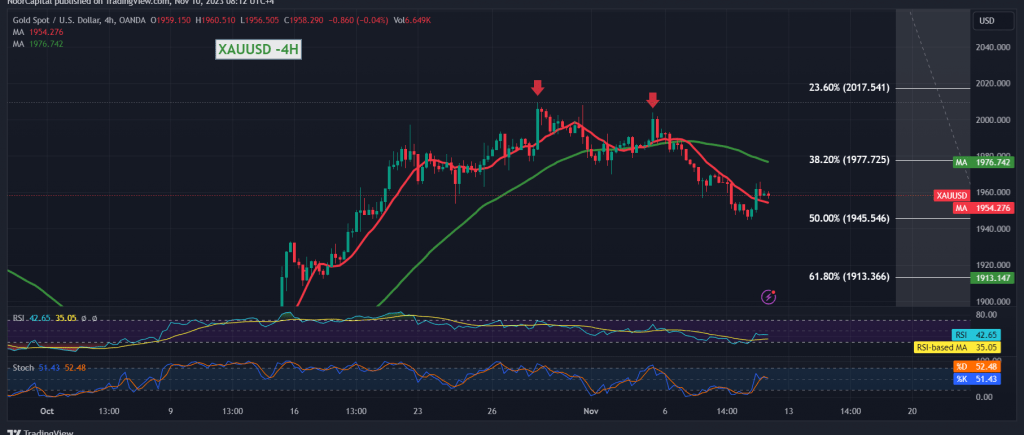
Gold prices have successfully established a robust support level at 1945, as highlighted in our previous report. The price’s ability to consolidate above this level could potentially lead to a retest of 1966.
Examining the technical aspects today, on the 4-hour timeframe chart, the price remains below the formidable resistance level of 1966, accompanied by sustained negative pressure on the simple moving averages. Concurrently, early signs of negativity have emerged on the Stochastic indicator, indicating a waning upward momentum.
In light of these indicators, we maintain our bearish outlook. A breach below 1945, constituting the 50.0% Fibonacci retracement, requires careful attention due to its significance in shaping the short-term trend. Such a breach would pave the way for targets at 1939 and 1934 as crucial support levels.
It’s important to note that gold’s ability to sustain positive stability above 1945 and regain trading strength above 1966 would promptly invalidate the bearish scenario. In such a case, the focus could shift to retesting the 1977 correction of 38.20%.
Warning: High-impact press talks today, including a speech by Christina Lagarde, Governor of the European Central Bank, and the release of the monthly GDP index from the United Kingdom, along with the “preliminary reading of the consumer confidence index” from the University of Michigan in the United States, may induce significant price fluctuations during the news releases.”
Note: Trading on CFDs involves risks. Therefore, all scenarios may be possible. This article is not a recommendation to buy or sell but rather an explanatory reading of the price movement on the chart.
| S1: |
 Noor Trends News, Technical Analysis, Educational Tools and Recommendations

