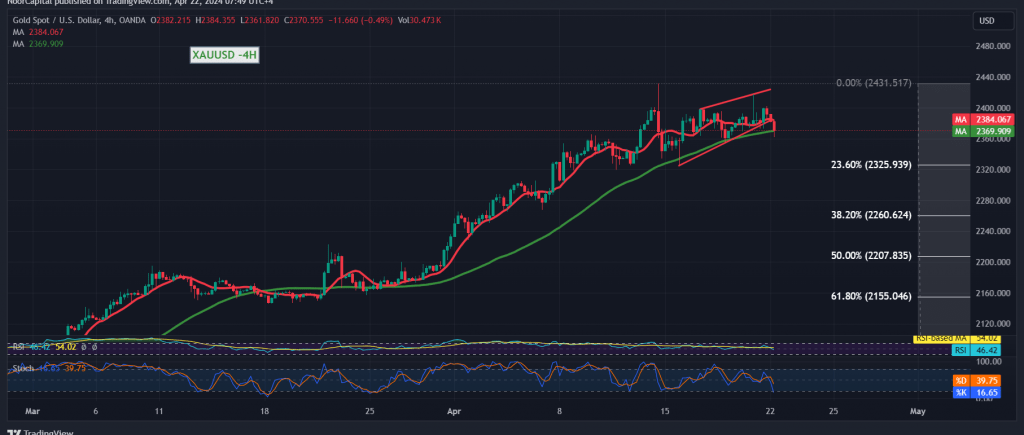
Gold prices commenced the first trading session of last week with a pronounced bearish sentiment, slipping below the significant threshold of $2400 per ounce. At the time of drafting this report, prices had dipped to approximately 2361 during the morning session.
Technically, on today’s 4-hour chart analysis, we observe gold prices testing the 50-day simple moving average, coinciding with the 2361 support level. Additionally, the Stochastic indicator signals negativity, accompanied by waning momentum on shorter time frames.
In the hours ahead, we anticipate a prevailing bearish bias, contingent upon a clear and robust breach of the 2361 support level. Such a move would likely pave the way for a visit to subsequent support levels at 2347 and 2325, marked by the 23.60% Fibonacci retracement.
It is crucial to highlight that a resurgence in trading stability above the resistance levels of 2400 and particularly 2403 could disrupt the downward correction. In such a scenario, gold prices may gather upward momentum, with an initial target set at 2438.
Risk Advisory: It is imperative to acknowledge the elevated risk level associated with these market dynamics, which may not necessarily align with the anticipated returns.
Risk Advisory: Given the ongoing geopolitical tensions, there exists a heightened probability of significant price fluctuations. Investors should exercise caution accordingly.
Note: Trading on CFDs involves risks. Therefore, all scenarios may be possible. This article is not a recommendation to buy or sell but rather an explanatory reading of the price movement on the chart
| S1: |
 Noor Trends News, Technical Analysis, Educational Tools and Recommendations

