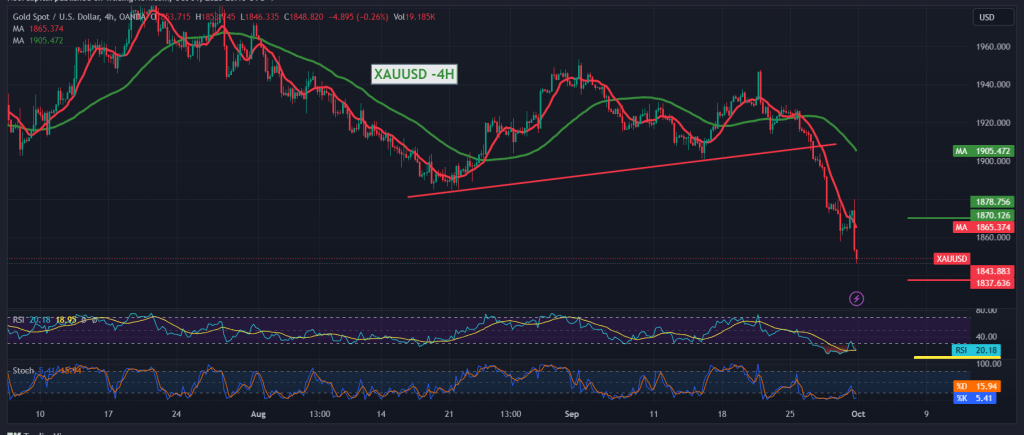
Gold prices suffered heavy losses during last Friday’s trading within the negative outlook expected during the previous technical report, touching the first target of 1853 and approaching, within a few points, of the second target of 1844, recording its lowest level at $1846 per ounce.
Technically, by looking at the 240-minute time frame chart, we find a continuation of the negative intersection of the simple moving averages, which continues to support the daily descending curve of prices and confirmation of breaking the 1869 support floor converted into a resistance level.
Therefore, the bearish scenario remains the most preferable during today’s trading, taking into account that sneaking below 1844 facilitates the task required to complete the bearish wave, as we are waiting for 1839 as the first target and then 1831 as the next station, whose negative targets may later extend towards 1815.
The price’s consolidation above 1870 with the closing of at least an hour candle will lead the price quickly and directly to retest 1888 and 1897, respectively, before the new price range is determined.
Note: Today we are awaiting high-impact economic data issued by the US economy, the Manufacturing Purchasing Managers’ Index, and the speech of Federal Reserve Chairman Jerome Powell, and we may witness high price fluctuations at the time the news is released.
Note: Trading on CFDs involves risks. Therefore, all scenarios may be possible. This article is not a recommendation to buy or sell but rather an explanatory reading of the price movement on the chart.
| S1: |
 Noor Trends News, Technical Analysis, Educational Tools and Recommendations

