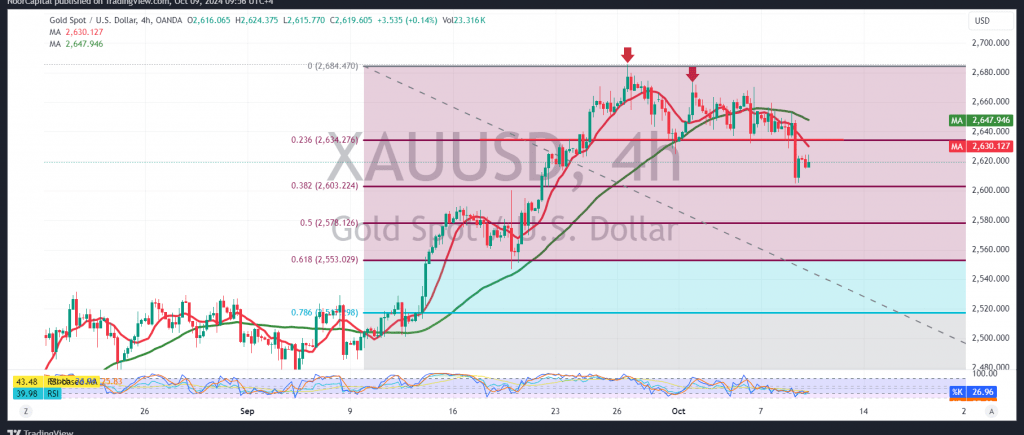
Gold prices saw a sharp decline yesterday, aligning with the negative outlook in the previous report, which anticipated a break of the $2645 support level, reaching the target of $2605 per ounce.
Today’s technical view suggests the potential for a continued corrective decline. The 240-minute chart shows a bearish alignment, with the simple moving averages forming a negative crossover, supporting the downtrend. Additionally, the double top pattern continues to exert downward pressure.
With intraday trading remaining below the broken support (now acting as resistance) at $2645, the downward corrective trend is favored. A clear break below the $2600 support level would accelerate the decline, targeting $2577 as the next key level.
On the upside, if prices regain stability above $2645, this could halt the bearish scenario, leading to a temporary recovery toward $2675 before determining the next move.
Warning: The broader trend remains upward despite the current correction.
Risk Alert: High-impact economic data, particularly the results of the “Federal Reserve Committee meeting,” may trigger significant price volatility.
Risk Reminder: The level of risk remains elevated amid ongoing geopolitical tensions, and various outcomes are possible.
Disclaimer: Trading in CFDs involves risks, and all scenarios are possible. This analysis is not investment advice but rather an interpretation of the current technical landscape for gold.
| S1: |
 Noor Trends News, Technical Analysis, Educational Tools and Recommendations

