
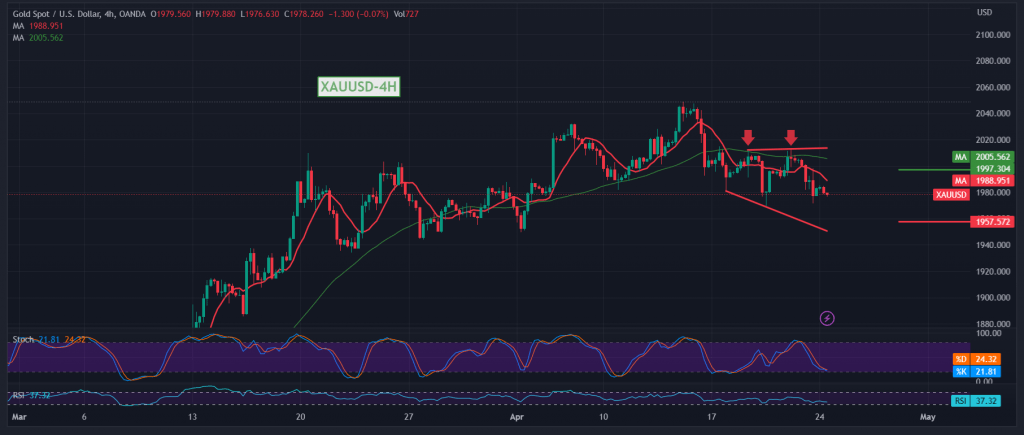
Negative pressure continues to control gold prices within a bearish corrective tendency, after prices failed to maintain stability above the broken 1992 support, to start its first weekly trading by pressing 1972 support.
Technically, and by looking at the 4-hour chart, we find that the simple moving averages continue to exert negative pressure on the price from above, and this comes in conjunction with the clear negative signs on the RSI on the short-term frames.
From here, with steady daily trading below 1992 and most importantly 1996, the bearish corrective scenario remains the most likely, targeting 1964 as the first target, and then 1954 as a next station. It must noted that the decline below 1950 increases and accelerates the strength of the corrective decline, to be waiting for 1930.
The price’s consolidation above 1997 will immediately stop the scenario suggested above, and we witness a direct recovery in gold prices towards 2018 initially.
Note: Trading on CFDs involves risks. Therefore, all scenarios may be possible. This article is not a recommendation to buy or sell but rather an explanatory reading of the price movement on the chart.
| S1: |