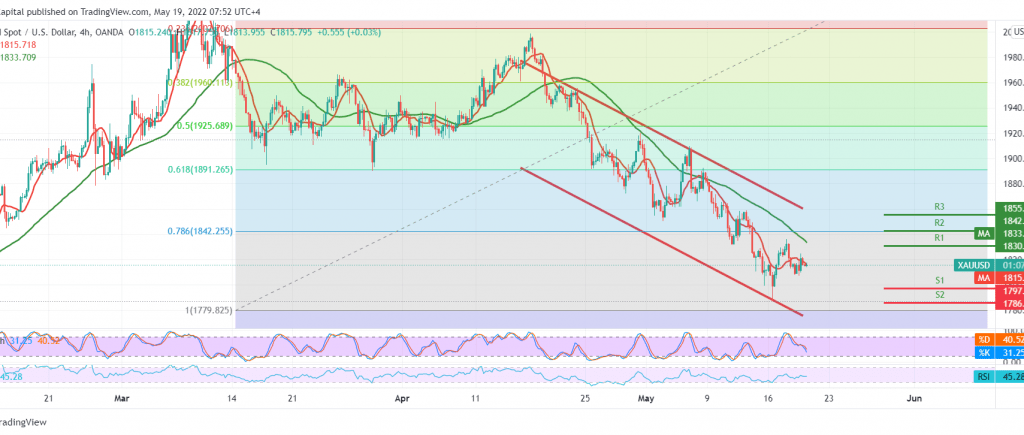
Gold prices maintained negative stability within the expected bearish context during the previous analysis after finding a strong resistance level around 1827, which forced the price to trade negatively again, maintaining the same technical conditions of the last report.
On the technical side, the current moves of gold are witnessing stability around its lowest level during the early trading of the current session 1807. With careful consideration of the 4-hour chart, we notice the continuation of the movement below the 50-day simple moving average and the stability of the RSI below the mid-line 50.
From here, and with the return of the stability of intraday trading below 1827 and most importantly 1832, the bearish scenario remains valid and effective, pushing our bearish targets to visit 1800/1798, taking into account that the decline below the mentioned level extends the losses of gold towards 1788 and 1785 respectively, initial targets that may extend later to visit 1772 .
We remind you that activating the above suggested bearish scenario depends mainly on stability below 1827 and generally below 1830, knowing that Rising again above 1830 leads gold to visit 1842/1840.
Note: Trading on CFDs involves risks. Therefore, all scenarios may be possible. This article is not a recommendation to buy or sell but rather an explanatory reading of the price movement on the chart.
| S1: |
 Noor Trends News, Technical Analysis, Educational Tools and Recommendations

