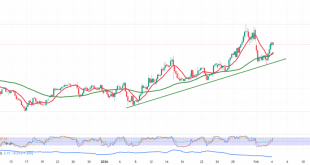
Gold prices were able to touch the expected official target we mentioned in the previous analysis, located at 1807, recording its lowest level at 1808.
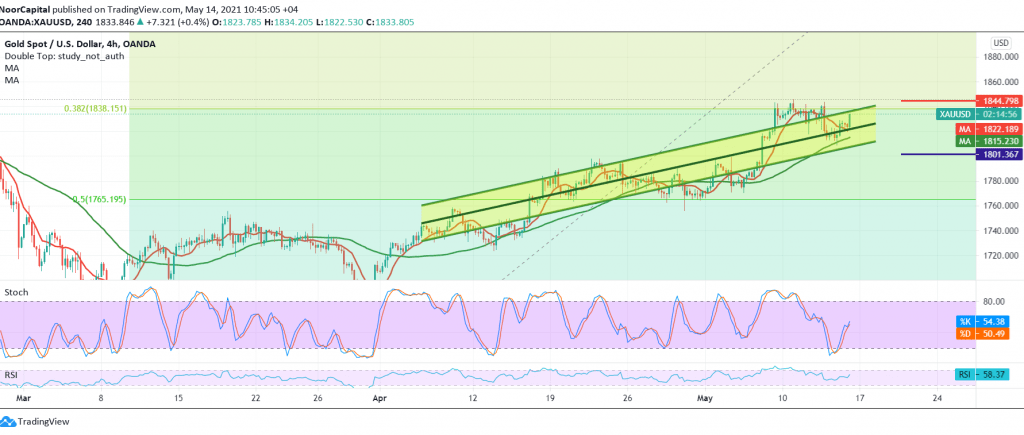
Technically, and with a closer look at the 4-hour chart, we find the stochastic indicator began to gradually lose the bullish momentum, in addition to the continuation of intraday trading below the resistance level 1836.
From here, we believe that the possibility of a return to the downside path is still present and effective, targeting 1821 and then 1816 respectively. It should also be noted that the stability of trading below 1816 facilitates the task required to visit 1800, the next stop.
Moving upwards and rising again above 1836, and more importantly, 1840 is able to postpone the descending scenario and witness an upward intraday path, initial target at 1848.
| S1: 1816.00 | R1: 1840.00 |
| S2: 1800.00 | R2: 1848.00 |
| S3: 1792.00 | R3: 1864.00 |
 Noor Trends News, Technical Analysis, Educational Tools and Recommendations

