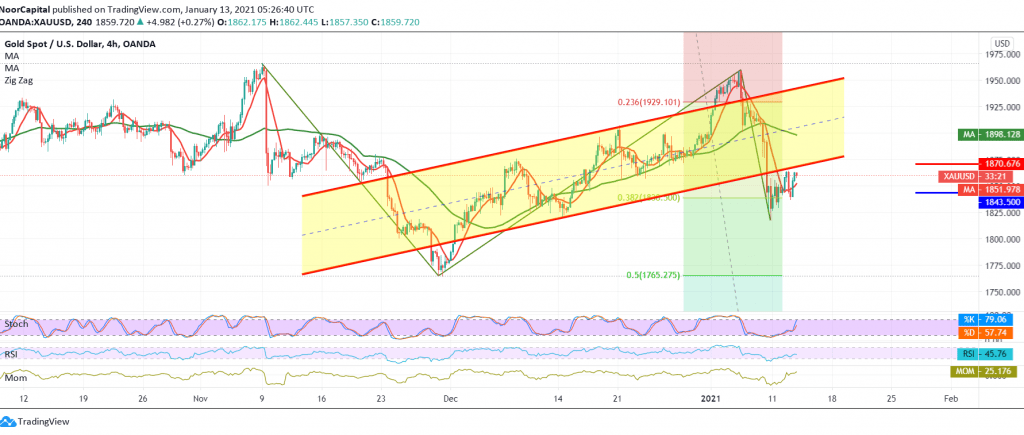
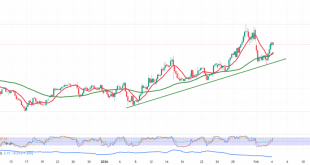
Gold prices managed to touch the first target to be achieved mentioned in the previous analysis, which is located around the support level of 1837, recording its lowest levels during the previous trading session at 1836.
Technically speaking, prices benefited from touching the support level represented by the target of 1836 within an upward slope aimed at re-testing the resistance level of 1865.
Looking at the 60-minute chart, we find the RSI tends to provide positive signals, and this contrasts with the continuation of negative pressure coming from the 50-day moving average, which is supported by the clear negative signs on the stochastic indicator.
We tend to be negative in our trading unless we witness a clear breach of the extended resistance level 1865/1870 knowing that the return of intraday stability again below 1843 facilitates the task required to visit 1836 and then 1826, and we must also pay close attention because confirming the break of the support floor of 1826 extends losses Gold to be waiting for 1816.
Only from the top, an increase above 1870 delays the chances for reversal, but does not cancel them, and we may witness a slight bullish tendency targeting 1880.
| S1: 1845.00 | R1: 1870.00 |
| S2: 1826.00 | R2: 1880.00 |
| S3: 1816.00 | R3: 1897.00 |
 Noor Trends News, Technical Analysis, Educational Tools and Recommendations

