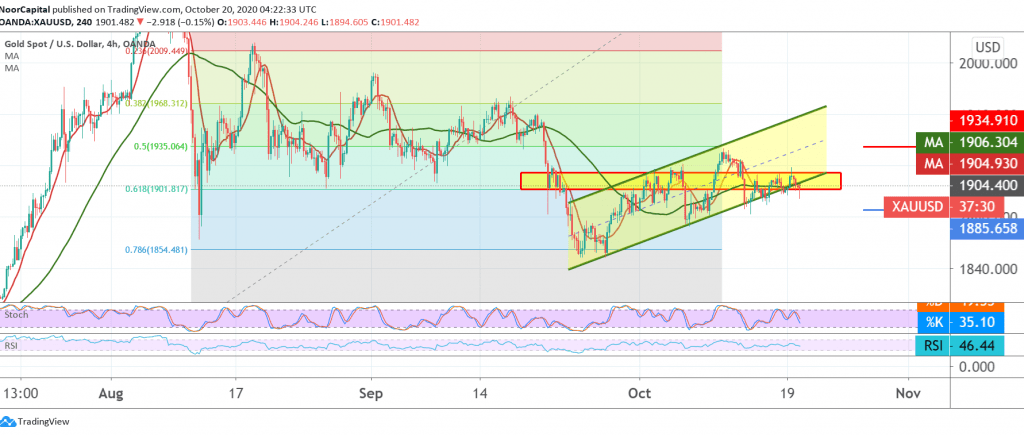
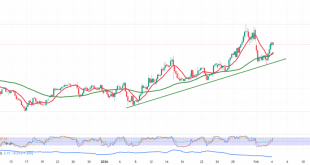
We stood on the sidelines during the first trading sessions of this week due to the conflicting technical signals, explaining that we are waiting for more clear signals as gold prices moving in a narrow sideways range confined from the bottom above 1901 and the top below 1913.
Technically speaking, looking at the 4-hour chart, we find the stochastic indicator is still trying positively, on the other hand the 50-day moving average continues to pressure the price from below, in addition to the intraday stability below 1910.
With the technical signals still conflicting, we will be neutral for the second session in a row, waiting for one of the following scenarios:
Activating short positions depends on witnessing a strong breakout of 1901, a correction of 61.80%, which puts the price under negative pressure, its initial target is around 1890, while the first official target is at 1882.
Activating long positions needs a clear breach of the 1913 resistance level, and stability above will open the way towards a re-test of 1928 and 1934, a 50.0% retracement.
CAUTION: careful consideration is required
| S1: 1890.00 | R1: 1914.00 |
| S2: 1880.00 | R2: 1928.00 |
| S3: 1866.00 | R3: 1938.00 |
 Noor Trends News, Technical Analysis, Educational Tools and Recommendations

