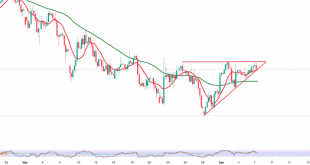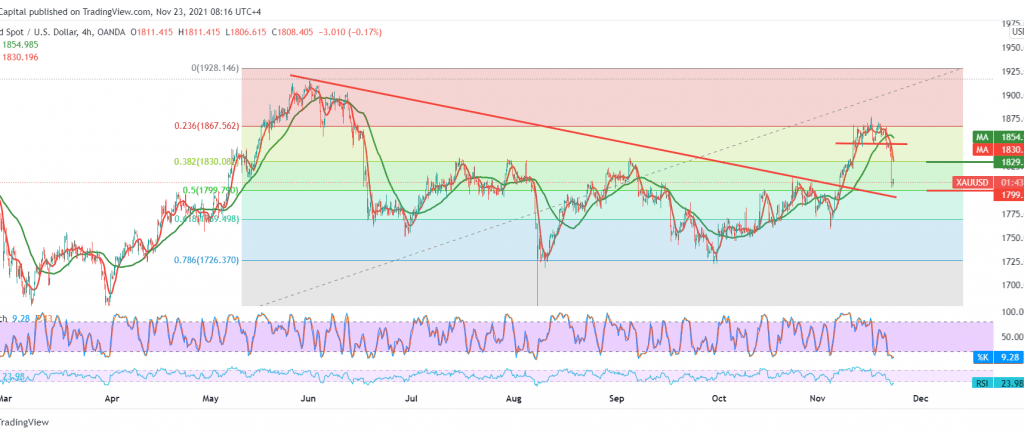
Gold prices experienced intense selling during the previous session’s trading. As we mentioned during the last analysis, signs of weakness in the bullish trend began to appear, surpassing the second official target 1830, recording the lowest of 1802.
Technically, we notice the beginning of a bearish technical structure that supports the continuation of the decline and the negative pressures coming from the simple moving averages and crossing the short-term average for the long-term one.
Therefore, the pessimistic scenario is the most preferred today, but the condition for confirming the breakout of the demand center point around 1799, 50.0% Fibonacci correction, as shown on the chart, and breaking it extends the losses and confirms the trend to the next price range 1769, 61.80% correction, towards 1754.
Rising above the previously broken support level 1830, a correction of 38.20% postpones the chances of a decline but does not cancel it. Generally, the trend is bearish as long as trading is stable below the pivotal supply point 1867.
| S1: 1790.00 | R1: 1837.00 |
| S2: 1772.00 | R2: 1867.00 |
| S3: 1743.00 | R3: 1884.00 |