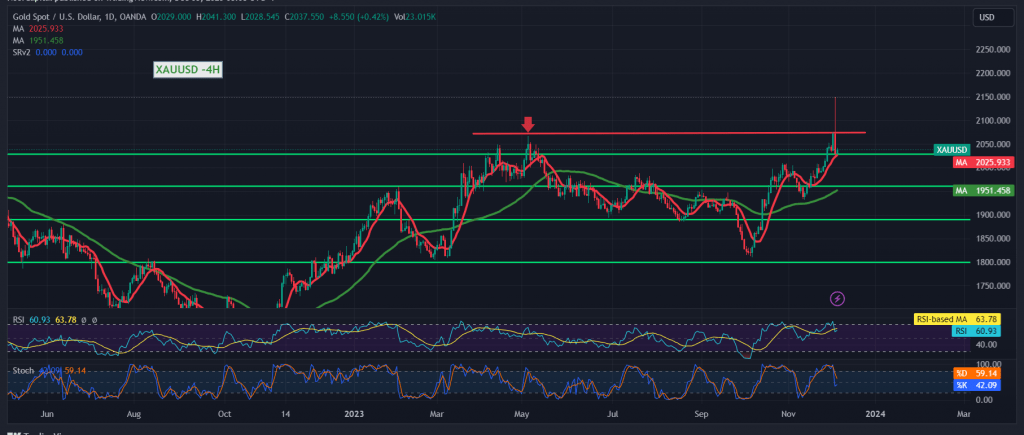
Gold exhibited erratic movements during the previous trading session, fluctuating between upward and downward directions. It reached a peak around $2,148 per ounce, only to experience a significant decline, concluding the session near $2,029.
From a technical standpoint today, observing the 4-hour chart reveals that the price has stabilized below the $2075 level, accompanied by noticeable negative signals on the Stochastic indicator.
The inclination is towards a negative outlook in trading. A breach of the $2029 level would likely pave the way for a retest of $2000 as the initial target, followed by $1988 as the subsequent significant level, unless there is a consolidation above $2075.
It’s essential to note that a return to stability above the robust resistance at $2075 has the potential to completely disrupt the bearish scenario, signaling a rise with a target of $2115.
Caution: The risk level is high, and there may be erratic movements where the expected return does not align with the risk.
Caution: Today, high-impact economic data from the American economy is anticipated, including the ISM Services Purchasing Managers’ Index, job vacancies, and the labor turnover rate. Expect potential high volatility during the news release.
Note: Trading on CFDs involves risks. Therefore, all scenarios may be possible. This article is not a recommendation to buy or sell but rather an explanatory reading of the price movement on the chart.
| S1: |
 Noor Trends News, Technical Analysis, Educational Tools and Recommendations

