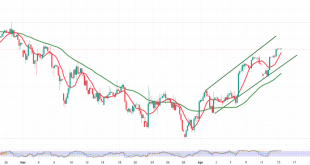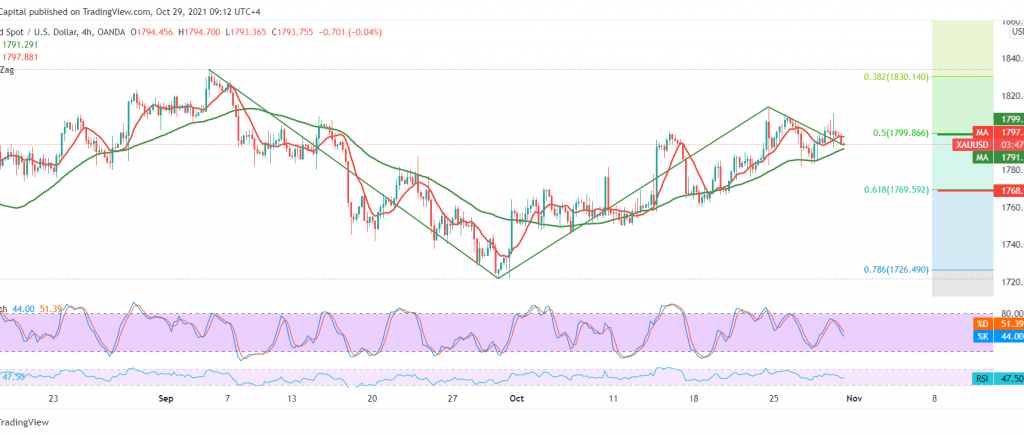
Gold prices found a strong resistance level around 1810, which forced it to trade negatively during the early trading of the current session, and it is now hovering around its lowest level during the session at 1792.
Technically, and with a closer look at the 240-minute chart, we find the 50-day moving average still supporting the bullish price curve, accompanied by the RSI attempts to get more bullish momentum on the short time frames. On the other hand, the current moves are witnessing stability below the key resistance 1799, 50.0% correction, counted by negative signs that started appearing on stochastic.
We stand on the sidelines for the moment to obtain a high-quality deal to waiting one of the following scenarios:
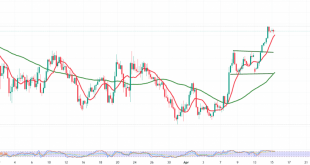
Activating long positions requires breaching the top of 1810 to target 1816 and 1825, respectively.
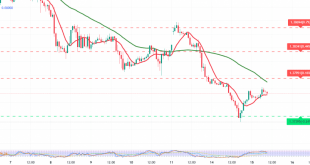
Activating short positions depends on confirming the breach of the support level 1786. From here, we are witnessing a negative session, with its initial target located around 1780, while its official target is located at 1768, 61.80% correction.
| S1: 1786.00 | R1: 1804.00 |
| S2: 1780.00 | R2: 1816.00 |
| S3: 1768.00 | R3: 1822.00 |