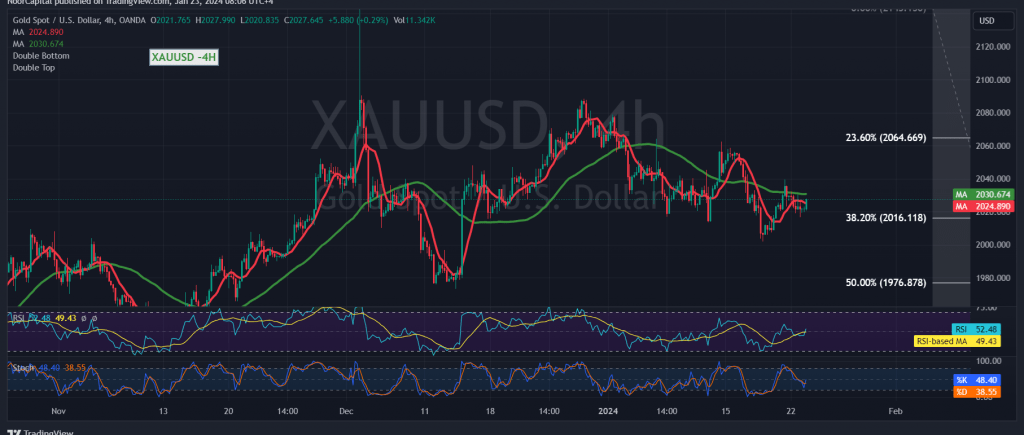
Gold has been trading within a narrow range, confined below the strong support level of 2016 and above the sub-resistance level at 2032, showing little significant change in its movements.
In terms of technical analysis on the 240-minute time frame chart, the price has returned to stability above the 2016 support level, which corresponds to the 38.20% Fibonacci retracement. While this supports a positive outlook, the 50-day simple moving average continues to act as an obstacle limiting further gains.
Given the conflicting technical signals observed for the second consecutive session, a preference is expressed for monitoring price behavior to identify high-quality trading opportunities. This observation leads to the consideration of two potential scenarios:
- Confirmation of the Upward Trend: A consolidation of the price above 2016 is essential. Additionally, a clear and robust breach of the 2032 resistance level would enhance the likelihood of a temporary upward movement towards 2041 and 2050. Subsequent gains could extend towards 2065.
- Resumption of the Downward Trend: If the price sneaks below 2016, confirmed by the closing of at least a one-hour candle, it renews the possibility of a downward trend resumption with initial targets at 2009 and an extension towards 2000. A breach below 1997 increases and accelerates the strength of the downward trend, opening a direct path towards 1989.
Warning: The risk level is deemed high, particularly amid ongoing geopolitical tensions, which may lead to increased price volatility.
Note: Trading on CFDs involves risks. Therefore, all scenarios may be possible. This article is not a recommendation to buy or sell but rather an explanatory reading of the price movement on the chart
| S1: |
 Noor Trends News, Technical Analysis, Educational Tools and Recommendations

