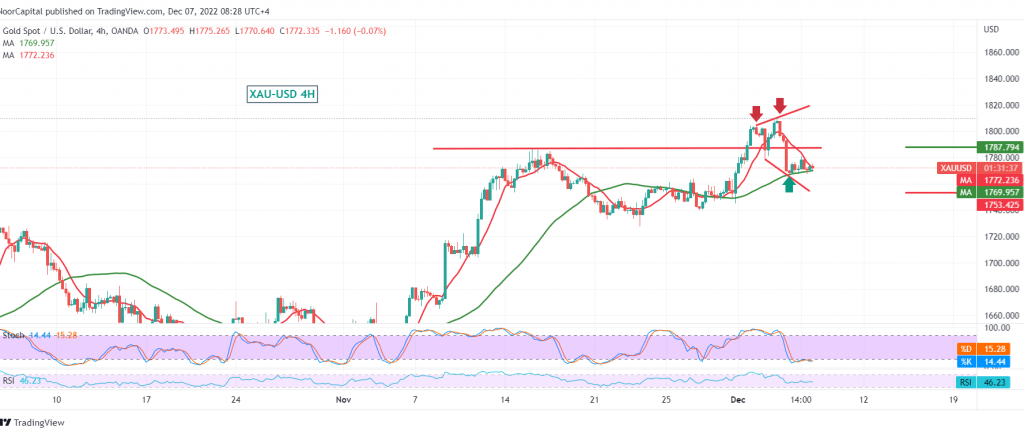
The support levels published during the previous technical report, at 1764, were able to limit the bearish slope that occurred with the first trading sessions of this week and forced gold prices to rebound, limitedly to retest 1780 during the previous trading session.
Technically, with a closer look at the 4-hour chart, we find the 50-day simple moving average trying to push the price to the upside, accompanied by an attempt to maintain trading above the support level of 1764, and this contradicts the clear decline in momentum on the relative strength index, which is stable below the mid-line. 50.
With the conflicting technical signals today, we prefer to monitor the price behaviour of gold to be facing one of the following scenarios:
To obtain a downside trend, it depends on breaking 1764, and from here begins a corrective decline; its initial targets are 1760 and 1753, while its official target is around 1736.
To get an upward trend, this requires a breach of 1780, which facilitates the task of resuming the bullish trend towards 1786 initial stations. Therefore, the price behaviour should be well monitored around this level due to its importance to the general trend on the intraday basis, and breaching it increases and accelerates the strength of the bullish trend, to be waiting for 1792 and 1800 initial stations, it may extend later towards $ 1818 per ounce.
Note: Trading on CFDs involves risks. Therefore, all scenarios may be possible. This article is not a recommendation to buy or sell but rather an explanatory reading of the price movement on the chart.
| S1: |
 Noor Trends News, Technical Analysis, Educational Tools and Recommendations

