
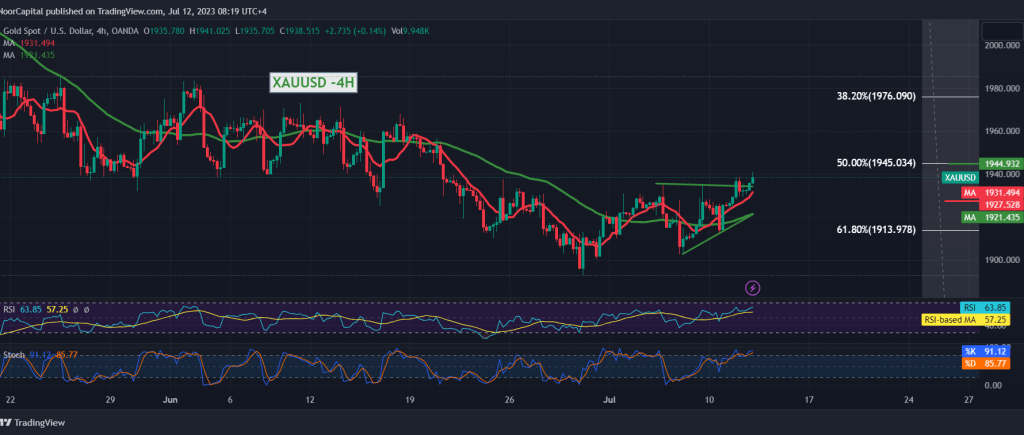
Gold prices witnessed an upward trend during the previous trading session as part of the continuation of the positive attempts to stabilize above the 1930 level, explaining that the price’s consolidation, at least an hourly candle above the 1930 level, can consolidate gold’s gains towards 1945, recording the highest $1941 per ounce.
Looking at the 4-hour chart, we notice the positive motive of the 50-day simple moving average, which meets around 1927 and adds more strength, in addition to the clear positive momentum signs on the 14-day momentum indicator. On the other hand, we find the stochastic indicator started sending negative signals, and prices are still stable below the 1945 resistance level.
With conflicting technical signals, we prefer to monitor the price behaviour to be in front of one of the following scenarios:
Continuing the bullish impulse depends on the stability of trading above the previously breached resistance of 1930, as we need to witness consolidation of the price above the main resistance level of the current trading levels 1945, Fibonacci correction 50.0%, and that extends the gains, opening the door to visit 1951 and 1961 as initial targets.
The return of the bearish trend will be valid if gold fails to breach 1945, and the break of 1927/1930 is confirmed. Therefore, we await a drop with initial targets 1917/1913.
Note: Today we are waiting for high-impact economic data issued by the US economy, “US inflation data, consumer price index”
From Canada, we are waiting for “the Bank of Canada interest statement, Canadian interest rates and the Bank of Canada press conference” \
From England, we are waiting for “the speech of the Governor of the Bank of England” and the report issued by the International Energy Agency on oil stocks. We may witness high volatility at the time of issuance of the news.
Note: Trading on CFDs involves risks. Therefore, all scenarios may be possible. This article is not a recommendation to buy or sell but rather an explanatory reading of the price movement on the chart.
| S1: |